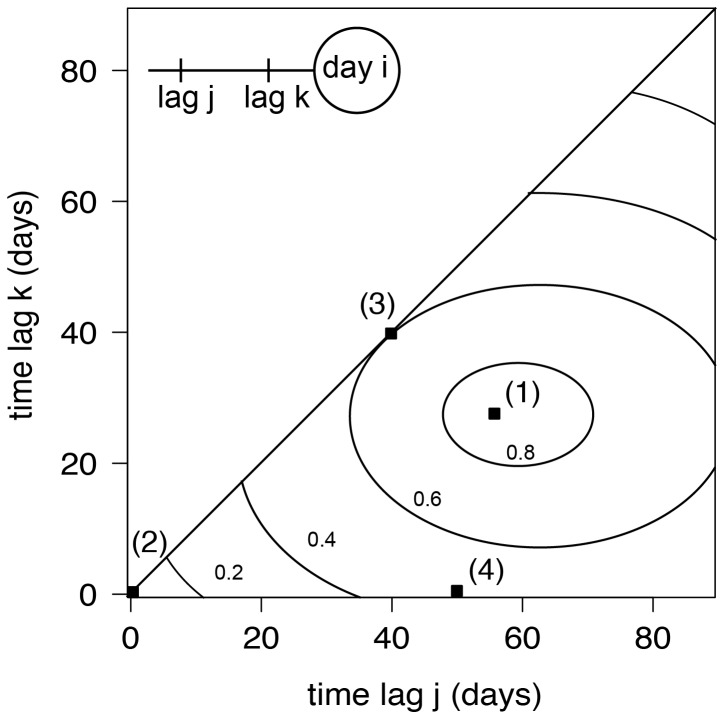
Figure 2. Schematic illustration of a cross correlation map (CCM).
(1) Maximum correlation of  for a dependent vs. an independent quantity. The latter averaged over the period of preceding days j = 60 to k = 30. (2) Commonly used correlation coefficient (without time lags, j = k = 0) of
  . (3) Cross-correlation (with one time lag, j = k = 40) of
  , which is equal to a cross correlation with a single time lag. (4) Cross correlation of r(50,0), the independent quantity was averaged over the preceding 50 days.

