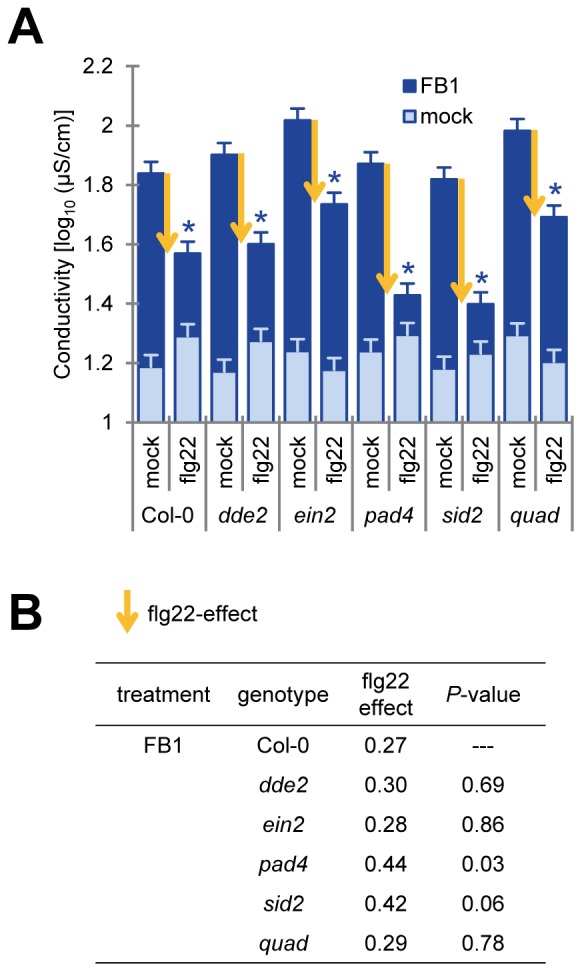
Figure 3. Flg22 pretreatment suppressed FB1-triggered cell death in dde2, ein2, pad4, sid2 and quadruple mutants.

(A) Quantification of FB1-triggered cell death by electrolyte leakage. This experiment was performed as described in Figure 1C except for the following differences. Twenty-four hours after pretreatment with water (mock) or 1 µM flg22, 1% methanol (mock) or 50 µM FB1 was infiltrated into the pretreated leaves of four-week old plants. Bars represent means and standard errors for biological replicates, calculated using a mixed linear model: four biological replicates were performed foreach of two independent experiments. Yellow arrows indicate the strength of the flg22 effect. Asterisks indicate significant differences from mock (P<0.001, two-tailed t-tests). (B) Comparison of the flg22 effect in the mutants for FB1-triggered cell death. The flg22 effect was estimated by subtracting the electrolyte leakage value of the flg22-treated sample from the value of the corresponding mock-treated sample. The flg22 effect in each mutant was compared with that in Col-0 using a two-tailed t-test using the standard errors calculated based on the mixed linear model to obtain the P-values. Quadruple mutant of dde2/ein2/pad4/sid2 was shown as quad.
