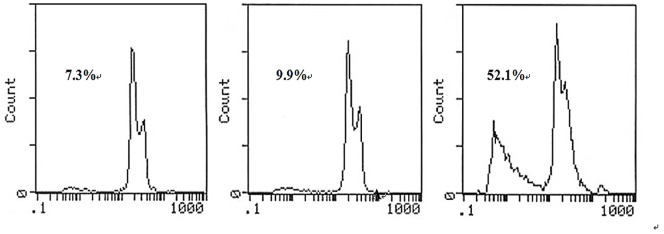
Figure 4. PAb-induced apoptosis in myeloma cell lines.

Flow cytometric analysis revealed the proportion of sub-G1 phase cells (apoptotic cells) to be 7.3% (NS), 9.9% (control), and 52.1% (PAb). The experiments were repeated at least three times.

Flow cytometric analysis revealed the proportion of sub-G1 phase cells (apoptotic cells) to be 7.3% (NS), 9.9% (control), and 52.1% (PAb). The experiments were repeated at least three times.