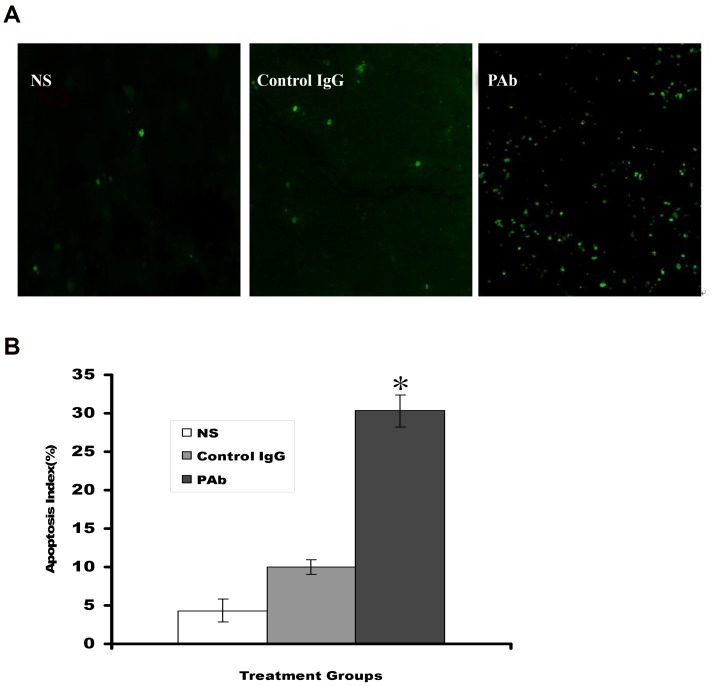
Figure 6. PAb-induced tumor cells apoptosis in vivo by TUNEL assay.
(A) Sections from the tumor-bearing mice treated with NS (left panel), control IgG (middle panel), or PAb (right panel) were stained with FITC-dUTP as described in the Materials and Methods section (200×). (B) An apparent increase in the number of apoptotic cells and apoptotic index was observed within residual tumors treated with PAb compared with other treatment groups in the ARH-77 subcutaneous injection tumor models. * represents the PAb group showing significant difference compared with NS and control IgG group mice (P<0.05).

