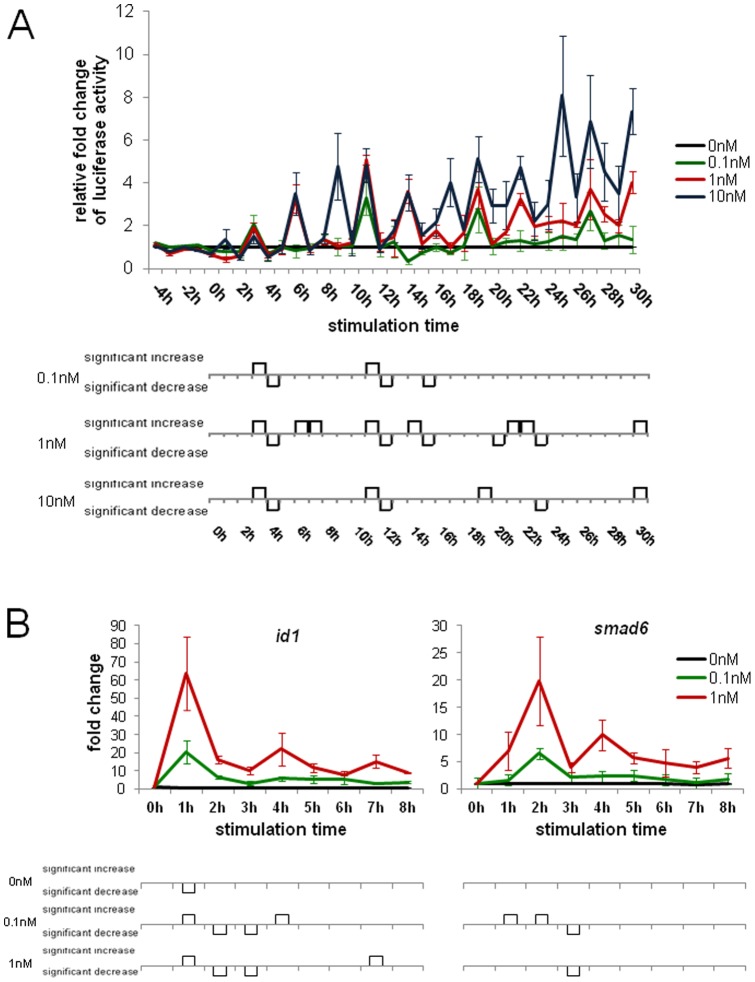
Figure 2. Gene expression analysis of continuously stimulated cells.
(A) 30 h experiment using cells that stably express the Gaussia Luciferase under control of a BRE minimal promoter. The cells were stimulated with either 0.1 nM (green), 1 nM (red) or 10 nM (blue) BMP2 or non-stimulated (black) as control, 50 µl medium were removed every hour and the Luciferase activity was measured. The relative fold change to the unstimulated control was calculated and assigned. (B) Quantitative real-time PCR was performed on the BMP target genes id1 and smad6. The cells were stimulated with 0.1 nM (green), 1 nM (red) BMP2 or non-stimulated (black) and every hour one sample was lysed and frozen at −80°C until the further processing.

