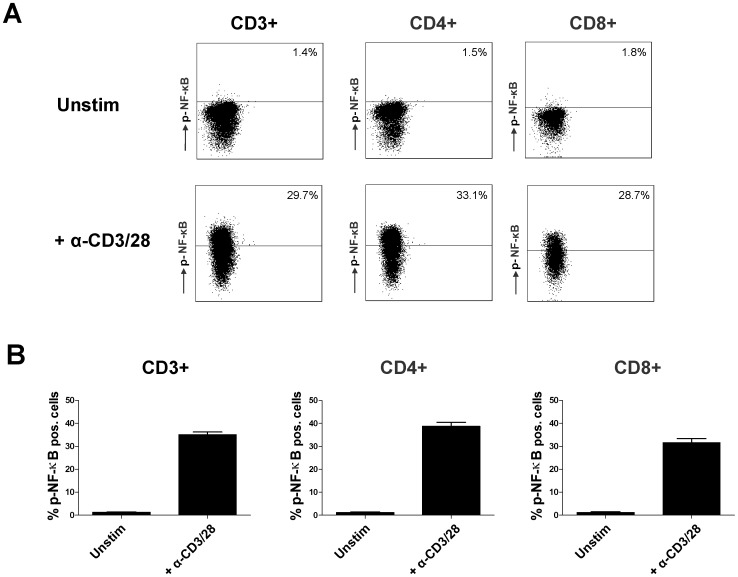
Figure 1. Facs analysis of NF-κB phosphorylation in T cells.
The total CD3+ T cell population was acquired by MACS isolation of PBMC from healthy volunteers. A) Example scatter dot plots of an unstimulated sample (above) and an anti-CD3/CD28 stimulated sample to illustrate the gating strategy for analysis of percentages CD3+, CD4+ and CD8+ T cells which express phosphorylated NF-κB. Both samples were stained with a monoclonal antibody against phosphorylated NF-κB p65. B) The average percentages of cells with elevated NF-κB phosphorylation in unstimulated and stimulated samples without drug are depicted as mean ± SEM of 6 independent experiments.

