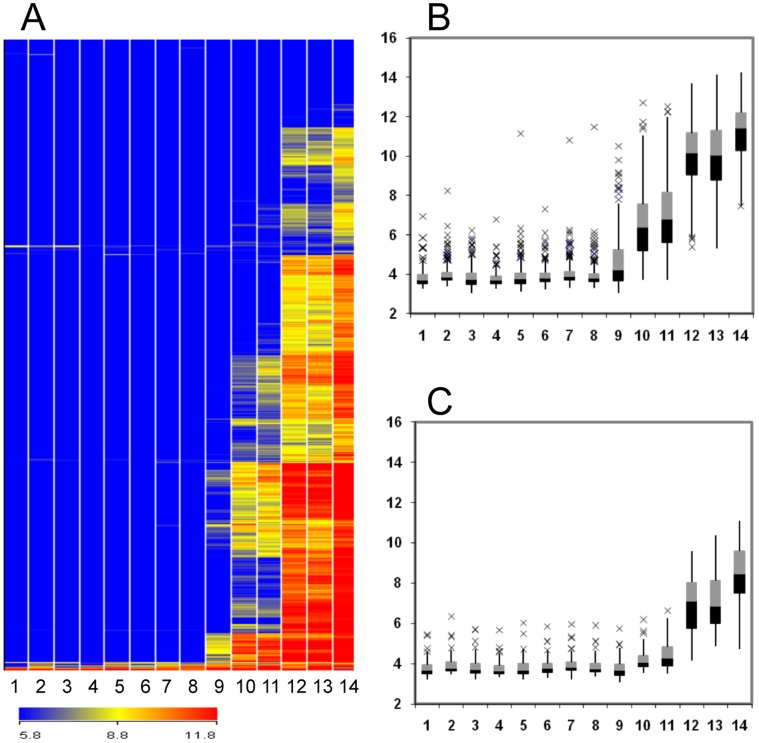
Figure 1. Expression profiles of NCRs.
Expression values are log2-transformed intensity values. A, Hierarchical clustering (Euclidian average) of 571 NCRs and 14 treatments. Columns 1, 2, 3, 4, and 5 are data for mock-inoculated roots at 0, 4, 7, 14, and 40 dpi, respectively; columns 6, 7, 10, and 12 are roots inoculated with S. meliloti mutants nodC, exoY, bacA and nifH at 14 dpi, respectively; and columns 8, 9, 11, 13, and 14 are roots inoculated with Sm1021 at 3, 4, 7, 14, and 40 dpi, respectively. Color scales representing signal intensities are shown at the bottom. B, Expression profiles of 346 early NCRs. C, Expression profiles of 79 late NCRs. The box and whisker plots represent five different groups of intensity values, the minimum of which is the lowest whisker, the 25% quartile is represented by the bottom box, the 50% quartile is indicated by the median line, the 75% quartile is represented by the top box, the maximum value is the highest whisker, and the outliers are represented by x’s.

