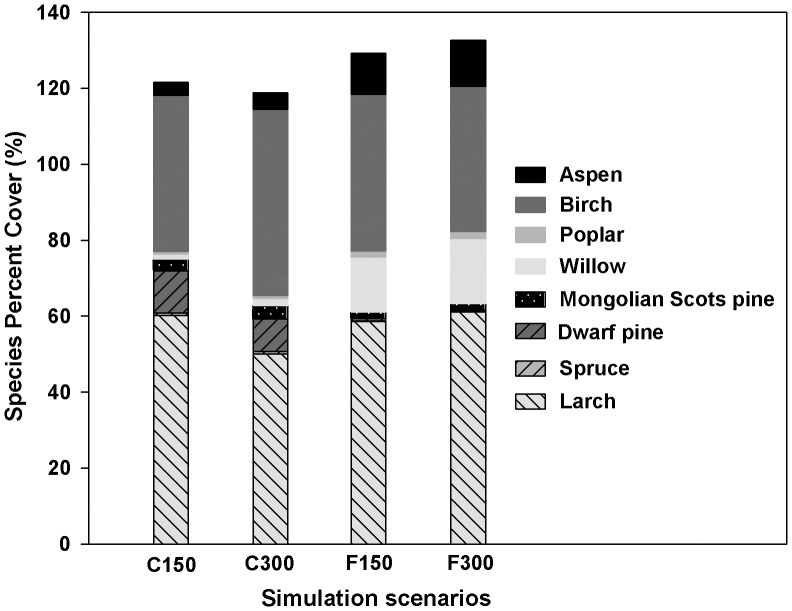
Figure 2. Responses of species composition to climate and fire under current harvest regime.
C150 represents the average of the simulated species abundance under current climate and fire regimes in 2000–2140 years; C300 represents the average of the simulated species abundance under current climate and fire regimes in 2150–2290 years; F150 represents the average of the simulated species abundance under future climate and fire regimes in 2000–2140 years; and F300 represents the average of the simulated species abundance under future climate and fire regimes in 2150–2290 years.

