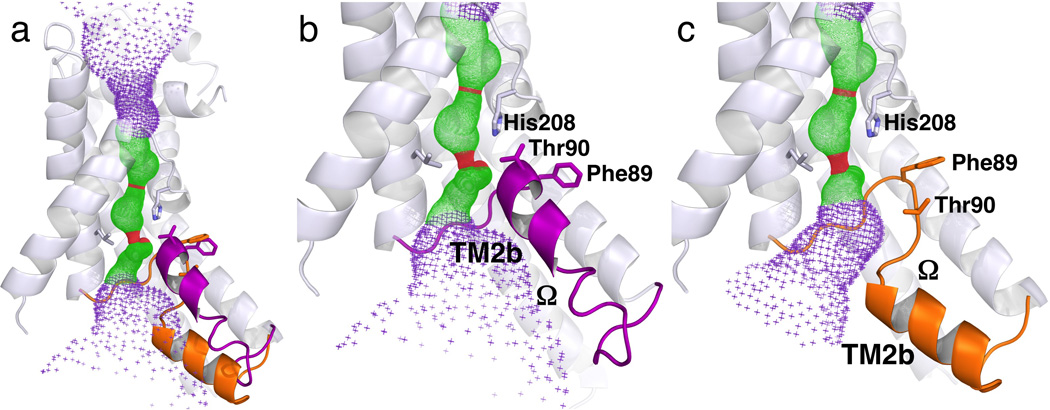
Figure 3.
Different configurations of the Ω loop that connects TM2a and TM3 in different FocA monomers, both from the low-formate structure. (a) Structure of Monomer A overlaid with the Ω loop from Monomer E. The Ω loop is colored purple in Monomer A and orange in Monomer E. (b) Close up view of the Ω loop including TM2b in the UP position in Monomer A. (c) Identical view of the Ω loop in the DOWN position in Monomer E. The TM2b helix is at difference positions between the two monomers in both physical space and in sequence. The helices 6 and 4 are removed for clarity. The pore in the center of the monomer as computed by the program HOLE 47 is shown for reference. The structures of Monomers B and C are the same as Monomer A, whereas the structure of Monomer D is similar to that of Monomer E.

