Figure 5.
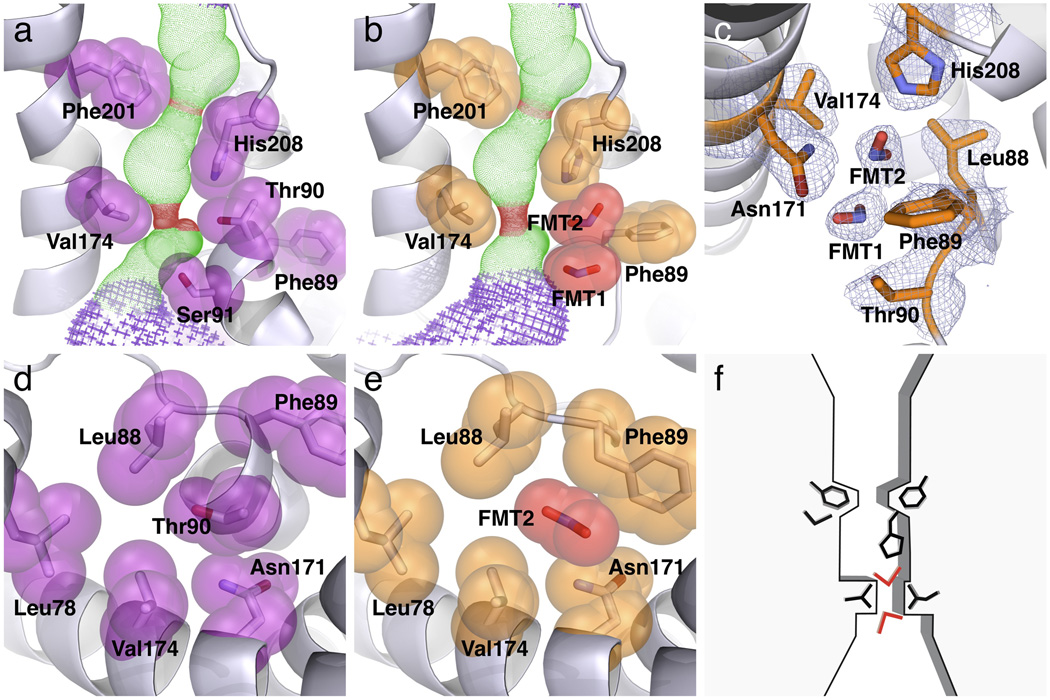
Selectivity structure and its interactions with formate. (a) Side view of the selectivity filter in the low-formate structure of Monomer A. Both the cytoplasmic slit and the central constriction ring are shown. The Ω loop is in the UP configuration, and Thr90 of the Ω loop makes a hydrogen bond with His208 of the S loop. (b) Side view of the selectivity filter in the high-formate structure of Monomer E, solved at 2.5 Å resolution from crystals grown in 120 mM formate. The Ω loop is in the DOWN configuration, and two formate ions (FMT1 and FMT2) are located in the cytoplasmic slit. (c) 2Fo-Fc electron density map showing the locations of the two bound formate ions in the selectivity filter (contoured at 1σ). Formate 2 makes hydrogen bonding with His208. (d) Top view of the cytoplasmic slit in the low-formate structure of Monomer A. Thr90 is surrounded by a ring of residues. (e) Top view of the cytoplasmic slit in the high-formate structure of Monomer E. Bound Formate 2 occupies the same position as the Thr90 side chain in Monomer A. (f) Schematic drawing showing the substrate selectivity filter in FocA.

