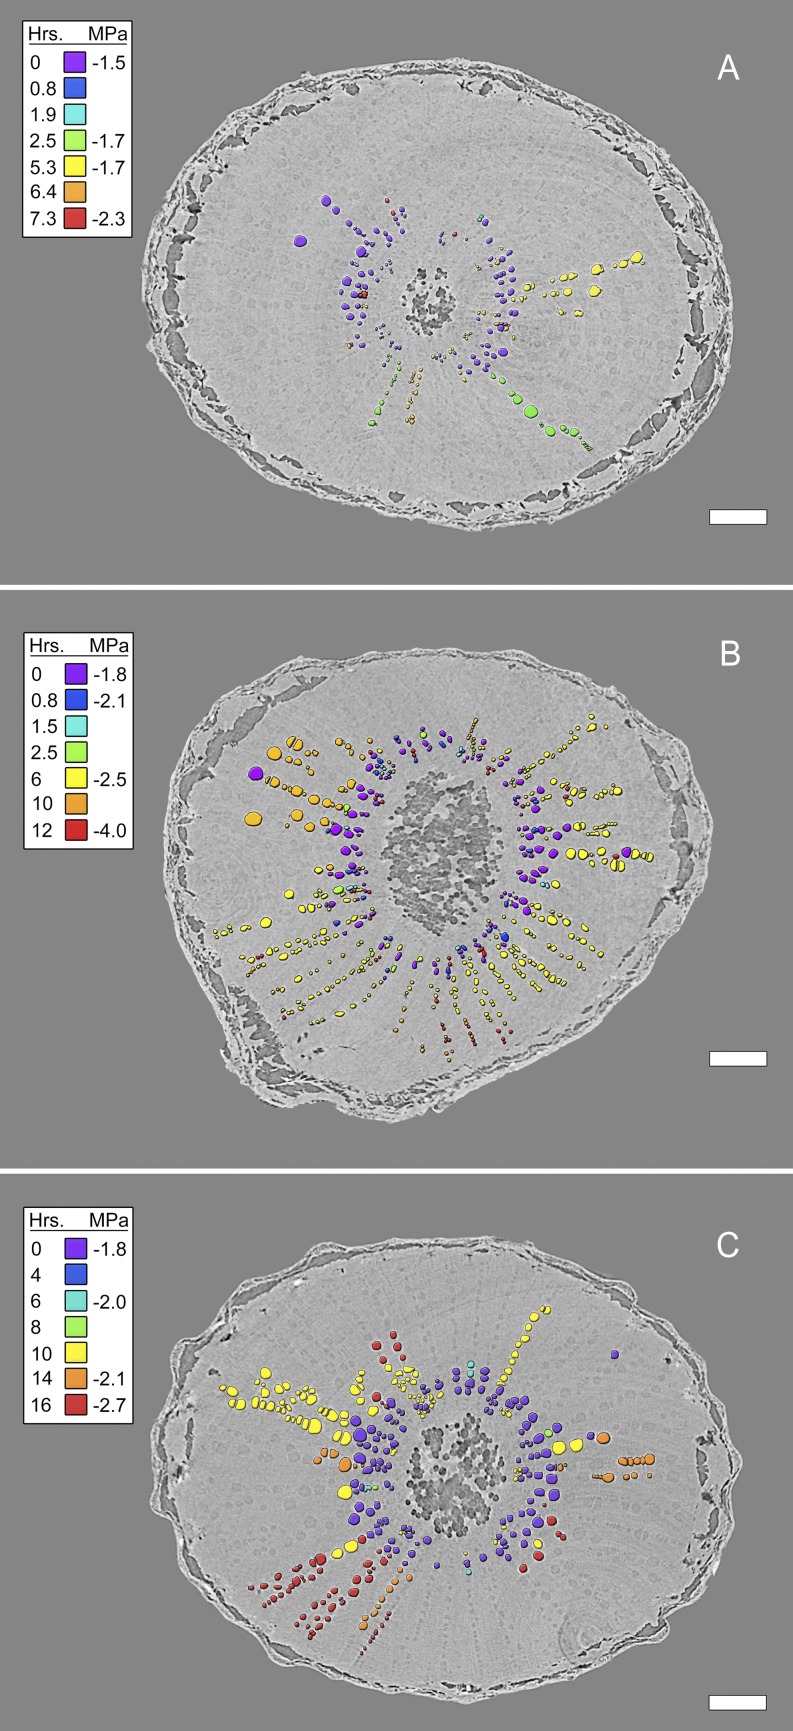
Figure 3.
Transverse HRCT micrographs through three grapevine stems showing the radial, sectored spread of embolisms during the simulated drought experiments as ψstem declined (MPa, legend inset). Vessel lumen color denotes the time point (hours [Hrs.], legend inset) at which gas was first observed inside the vessel. Bars = 1 mm.

