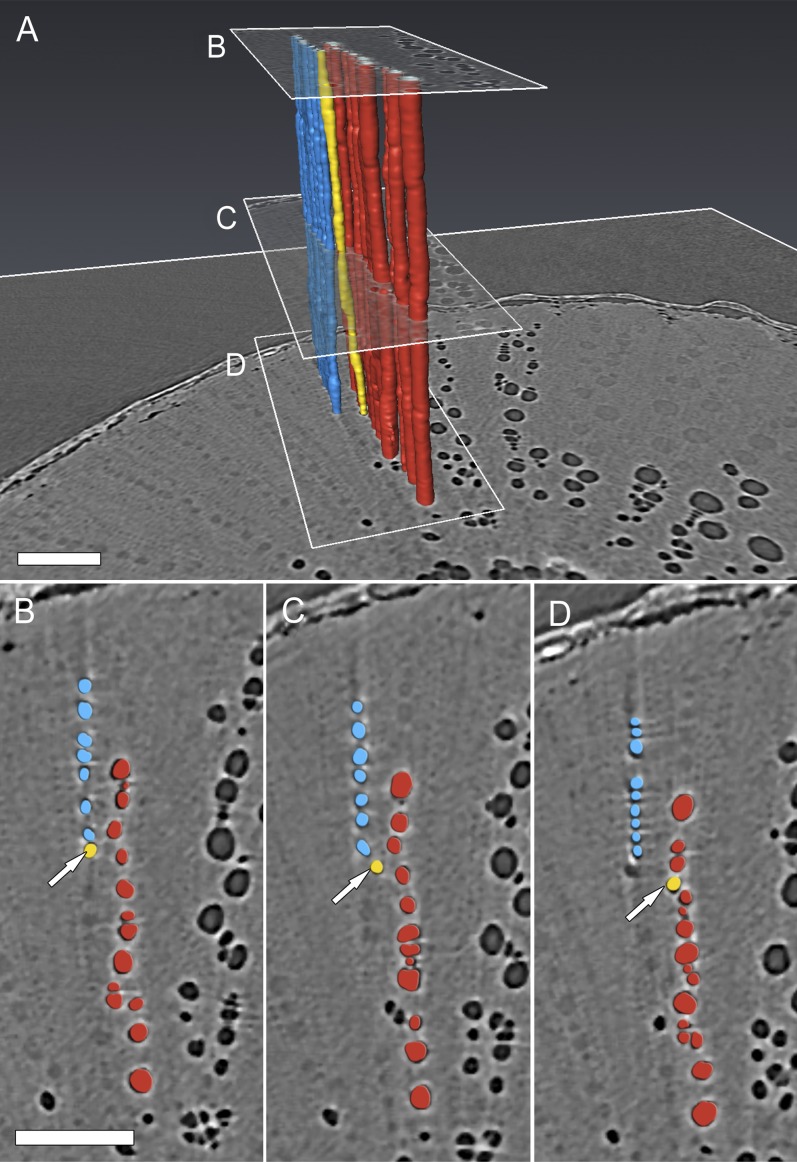
Figure 5.
A, Transverse HRCT micrographs and volume renderings of grapevine vessels showing a pathway for embolism spread between sectors (magnified view of Fig. 2D). B to D, Transverse views through the vessel group. Vessels in the red sector embolized first and then spread through a vessel (yellow) that drifted tangentially from the red sector to the blue sector. Bars = 250 µm.

