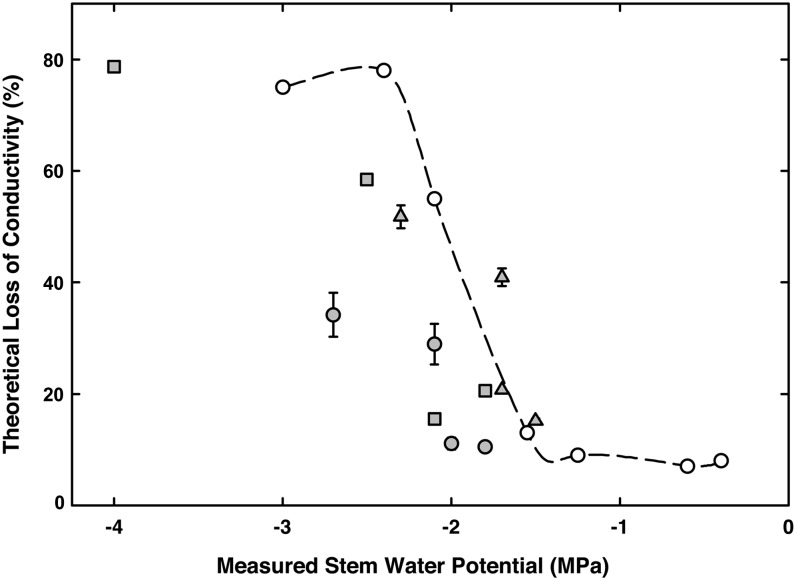
Figure 7.
Theoretical loss of hydraulic conductivity of three grapevine plants (gray symbols) calculated from the diameters of embolized vessels during drought experiments. Superimposed are data (white symbols, dashed line) from Choat et al. (2010), where loss of conductivity was measured and paired with NMR imaging. Bars indicate predicted error generated by adding or subtracting 4.5 µm from the vessel diameter measurements.

