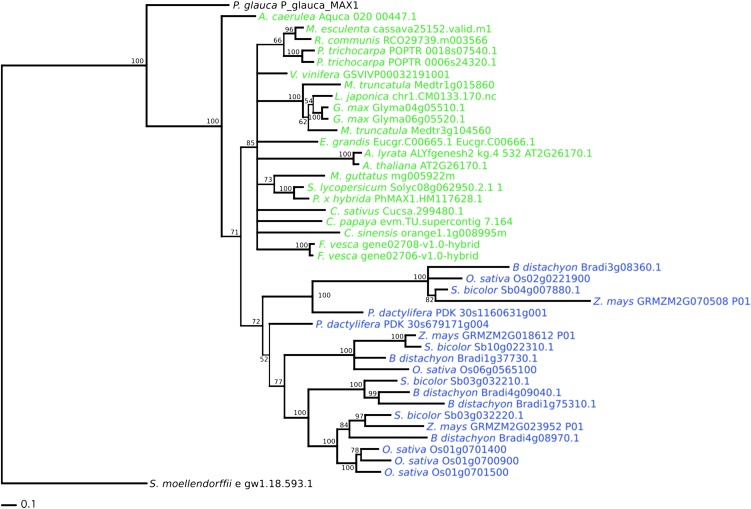
Figure 2.
Phylogenetic tree depicting the relationship between putative orthologs of MAX1 across 24 plant species. Additional sequences were included for some experimentally determined orthologs in species for which no genome sequence was available. Protein sequences were aligned using MAFFT (Katoh et al., 2005), and DNA sequences were aligned to the protein alignment using Transeq from the EMBOSS suite (Rice et al., 2000). Phylogenies were reconstructed from the DNA alignments under the general time-reversible plus γ model using RAxML (Stamatakis, 2006), and support was assessed using 100 rapid bootstrap resamplings (Stamatakis et al., 2008). Dicotyledon sequences are colored green, and monocotyledons are colored blue.

