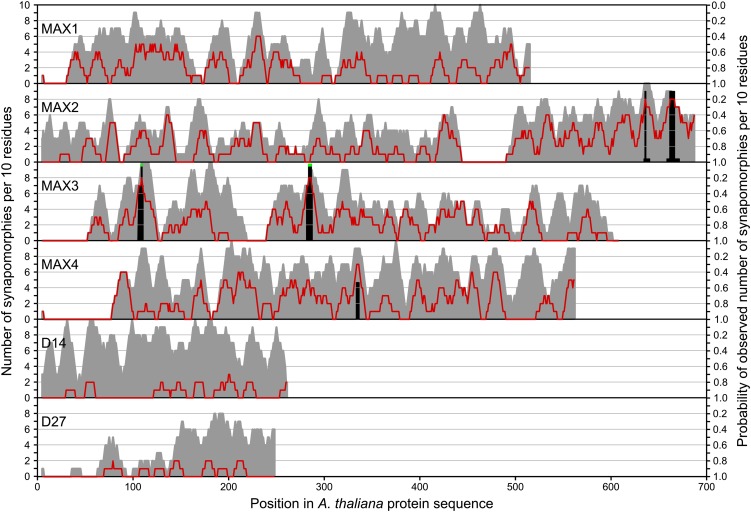
Figure 7.
Sliding-window analysis (n = 10) highlighting the distribution of uniquely conserved residues across the ortholog set alignments for each of the MAX genes. For each gene, the gray area indicates the density of conserved residues, the red line indicates the density of synapomorphic residues that are conserved in the ingroup but differ from the wider gene family, and black bars show the probability of the observed density of synapomorphic residues occurring due to chance; regions with less than 5% probability are highlighted with green tips.

