Figure 5.
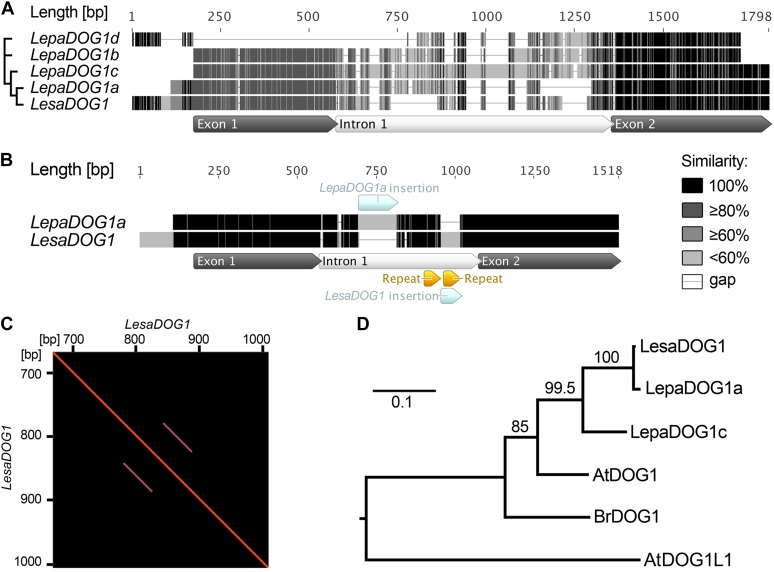
Comparison of L. papillosum and L. sativum DOG1 genomic sequences and phylogenetic analysis of predicted Brassicaceae DOG1 protein sequences. A, Multiple alignment of the genomic LepaDOG1a (JX512183), LepaDOG1b (JX512184), LepaDOG1c (JX512185), and LepaDOG1d (JX512186) DNA fragments (for details, see Supplemental Table S1) as compared with the LesaDOG1 gene (Graeber et al., 2010). We applied a grayscale coloring scheme according to the similarity of the residues in the alignment. A certain residue in a sequence is colored black if it is 100% identical to the other residues in the same alignment column. A residue is colored dark gray if it occurs identically in 80% of the positions in a column (e.g. four out of five position in a column). A residue is colored moderate gray if it occurs identically in 60% of the positions in a column (e.g. three out of five positions) or light gray if it occurs identically in less than 60% of the positions in a column (e.g. one or two out of five positions in a column). Internal gaps are treated as unknown characters, and end gaps are not considered in the similarity calculation. Gaps are shown as horizontal lines. The annotation of exon-intron structure below the alignment is based on LesaDOG1. Note that the position of the intron splice site is conserved, as verified by comparison with LepaDOG1a/LepaDOG1c cDNAs. The relationship of the sequences to each other is indicated on the left by a maximum-likelihood cladogram. B, Pairwise alignment of the genomic sequences of LepaDOG1a with LesaDOG1. Only minor nucleotide changes are present in the two exon regions, and the positions of the introns with InDels are indicated. Note that in this pairwise alignment, only identical residues are colored black; otherwise, they are light gray. C, Dot-blot analysis demonstrating the presence of repeat elements in the LesaDOG1 intron sequence indicated as parallel lines. The LesaDOG1 sequence used for this self-dot-blot analysis corresponds to that shown in B, and the detected repeat locations are marked there. Note that the first repeat sequence is present in LesaDOG1 and LepaDOG1a, while the second repeat sequence is missing in LepaDOG1a. D, Maximum-likelihood phylogenetic tree of predicted protein sequences for Brassicaceae DOG1 genes for which transcript expression in seeds has been demonstrated by Bentsink et al. (2006; AtDOG1, α-splice variant), Graeber et al. (2010; LesaDOG1, BrDOG1), and in this work (LepaDOG1a, LepaDOG1c) in relation to the Arabidopsis DOG1-Like1 gene (AtDOG1L1). The scale bar indicates substitutions per site, and values on branches show bootstrap support. Phylogenetic analysis was performed using PhyML (for details, see “Materials and Methods”). [See online article for color version of this figure.]

