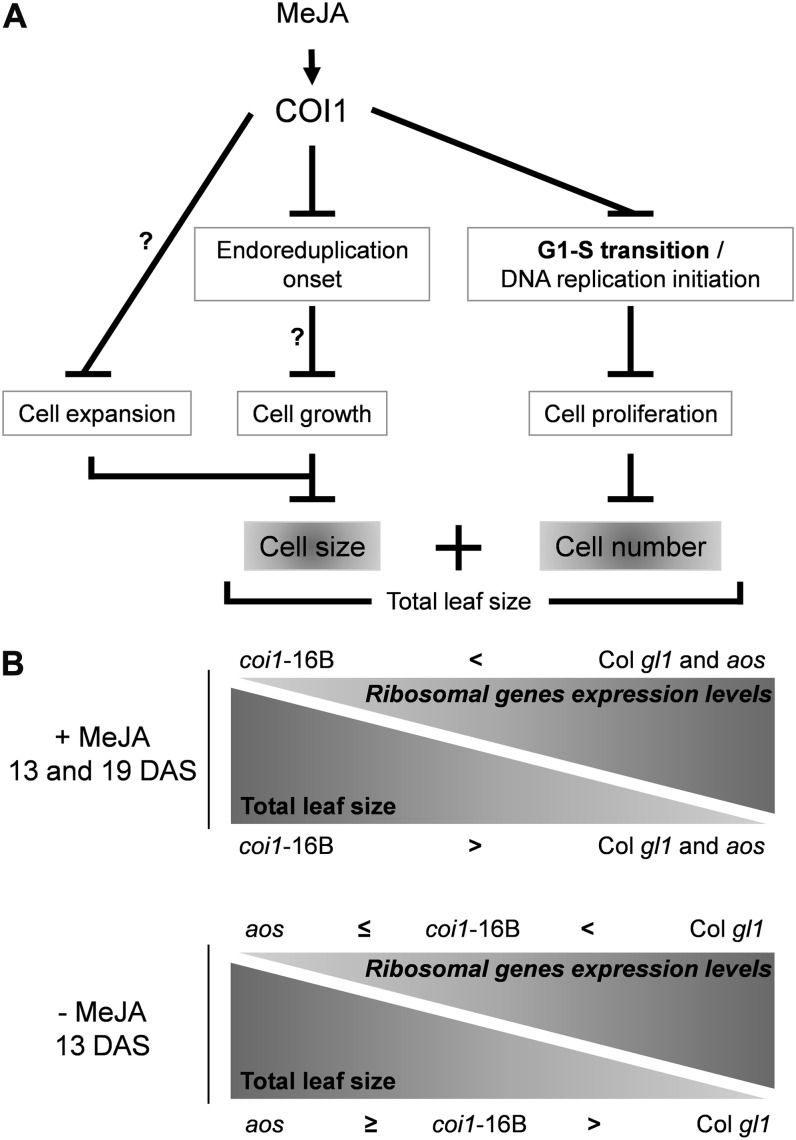
Figure 10.
Working model summarizing some of the key processes revealed to be regulated by continuous MeJA treatment to control leaf size. A, The combination of cell size and cell number determines the total leaf size, and this is regulated by MeJA. B, Inverse correlation between leaf size and ribosomal gene expression. To a MeJA-dependent reduction in leaf size of aos and Col gl1 corresponds higher global ribosomal gene expression levels. (This figure is adapted and expanded from Sugimoto-Shirasu and Roberts, 2003.)

