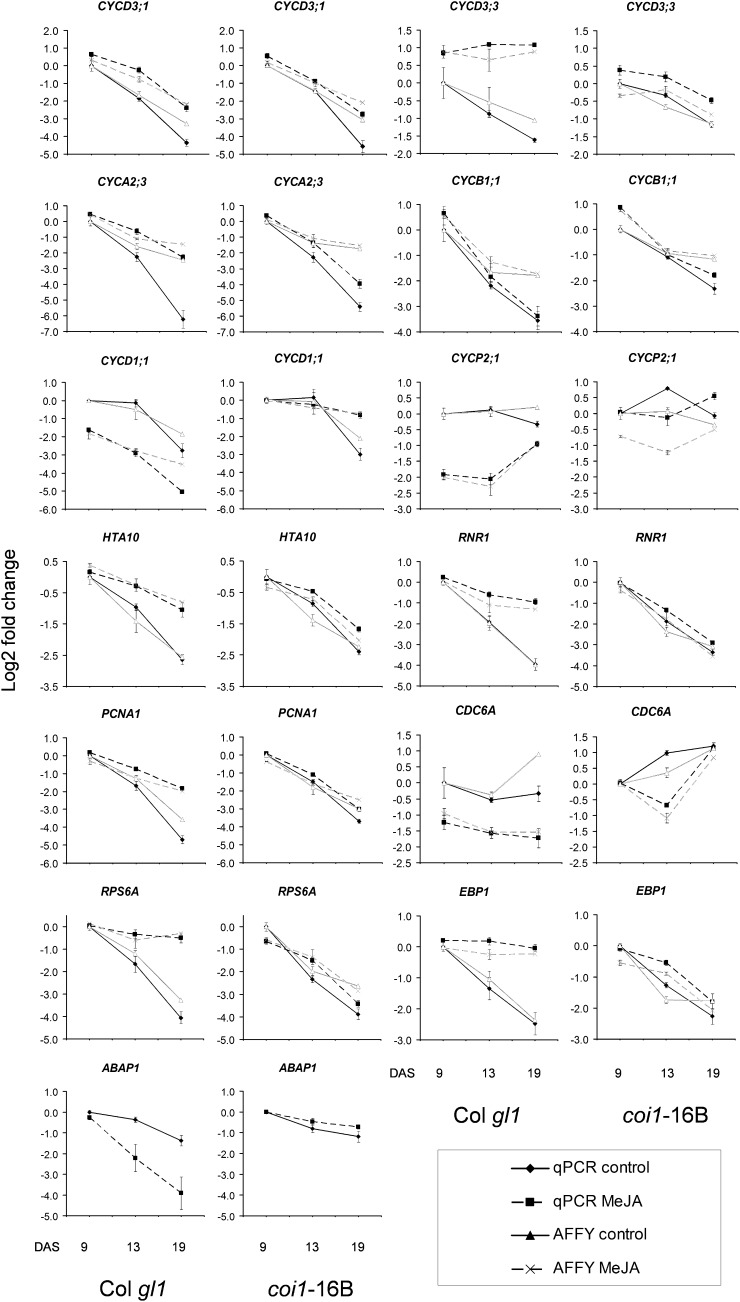
Figure 8.
QRT-PCR validation of microarray-detected changes in MeJA-responsive genes in Col gl1 and coi1-16B. Single RNA samples from each time point tested for microarray analysis were used in triplicate for relative QRT-PCR (as a ratio against the geometric mean of two internal control genes; Vandesompele et al., 2002). For details, see “Materials and Methods.” The genes were selected as representative of those differentially regulated in the first leaf pair of Col gl1 in comparison with coi1-16B during development upon continuous MeJA treatment. The black and gray lines represent the expression levels from QRT-PCR and from RMA-normalized microarray values from Affymetrix ATH1, respectively; continuous and dashed lines represent untreated and treated samples, respectively. Both QRT-PCR and microarray expression levels are shown as log2 fold change. Data are averages ± se of three independent biological replicates, two of which are independent from the microarray experiments. For each genotype, data from the 9-DAS untreated sample are used as the baseline expression value (calibrator).

