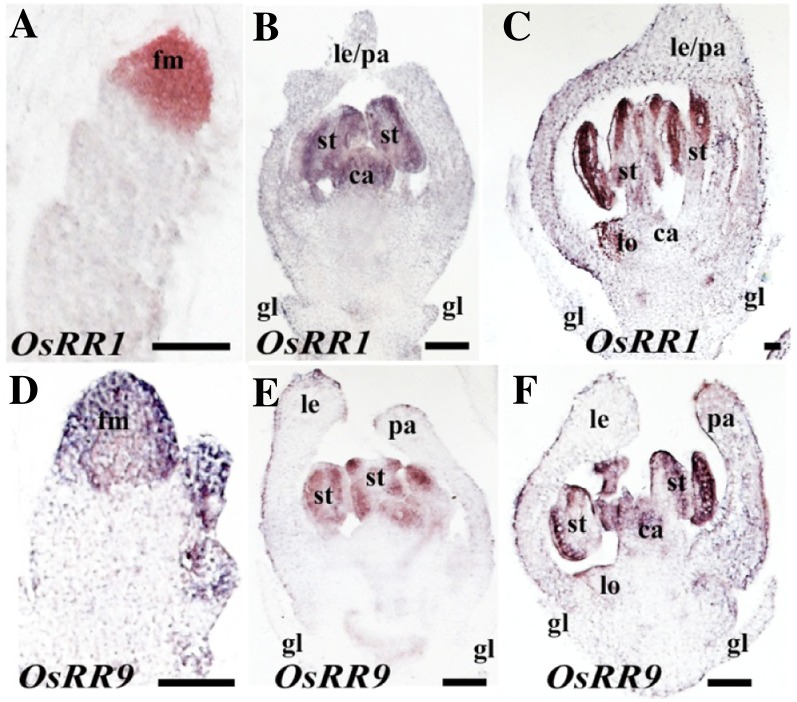
Figure 6.
Spatial distribution of OsRR1 and OsRR9 transcripts in developing wild-type florets. A to C, Expression pattern for OsRR1. D to F, Expression pattern for OsRR9. A and D, FMs with emerging lemma/palea primordia. B and E, Florets at the early stages of inner floret organ development. C and F, Florets with nearly mature organs. Organs are labeled as in Figure 3. Bars = 50 µm.

