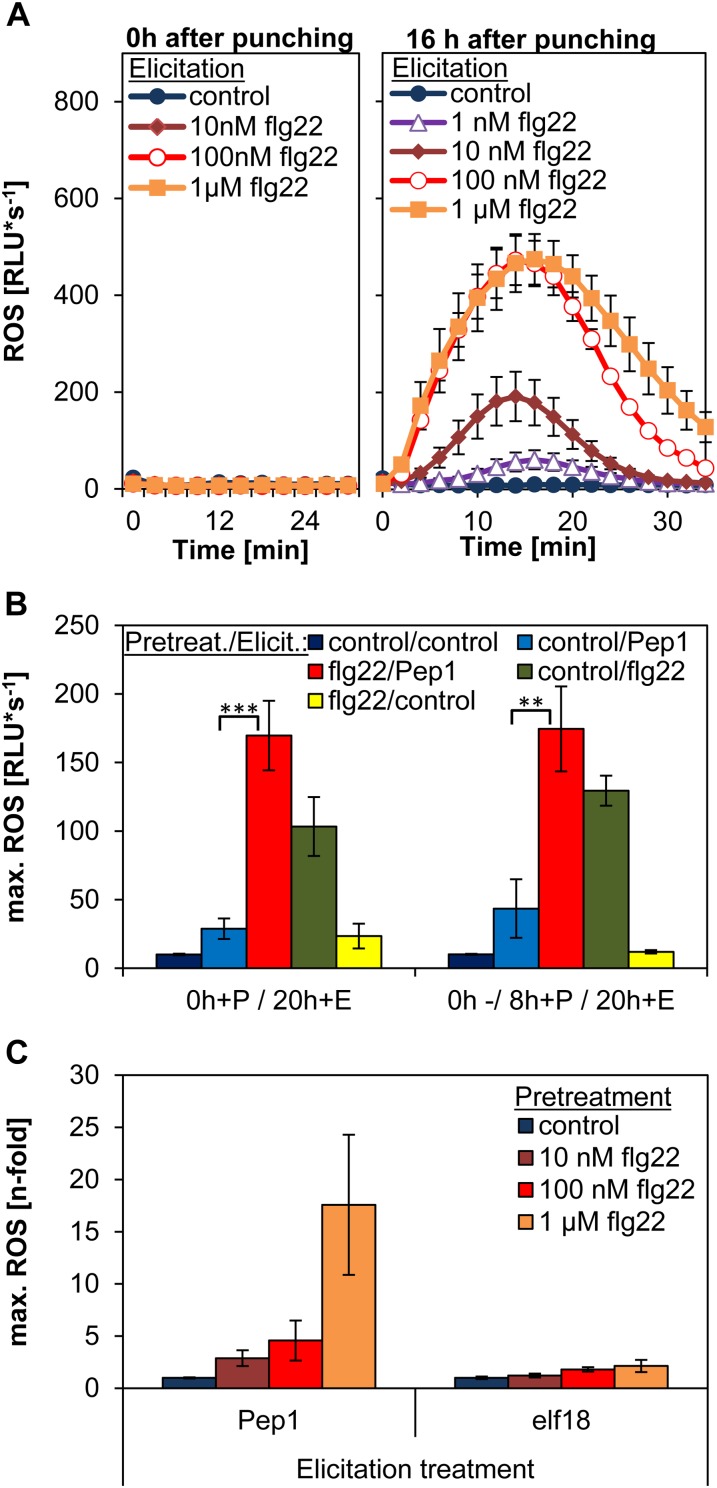
Figure 6.
Enhanced AtPep ROS is independent of previous ROS production. A, Leaf discs were treated with the indicated concentrations of flg22 either directly after punching (left) or after the standard 16-h incubation time floating on water (right). Graphs display averages of 12 replicates. Error bars show se of the mean. B, Indicated pretreatment (1 µm flg22 or without any peptide [control]) was performed either directly after punching (0h+P/20h+E) or at 8 h after punching (0h-/8h+P/20h+E). Twenty hours after punching, all leaf discs were treated with indicated elicitors or without any peptide (control). Columns represent averages of the peak values of ROS production of eight biological replicates. Error bars show se of the mean. C, Relative effect of pretreatments on ROS production. Leaf discs were pretreated as indicated for 16 h and then treated with either 1 µm AtPep1 or 1 µm elf18 (elicitation). Columns represent relative averages of the peak values of ROS production normalized to the respective control treatment. Error bars show se of the mean of 12 biological replicates. Asterisks represent Student’s t test results (**P < 0.01, ***P < 0.001). RLU, Relative light units.

