Figure 7.
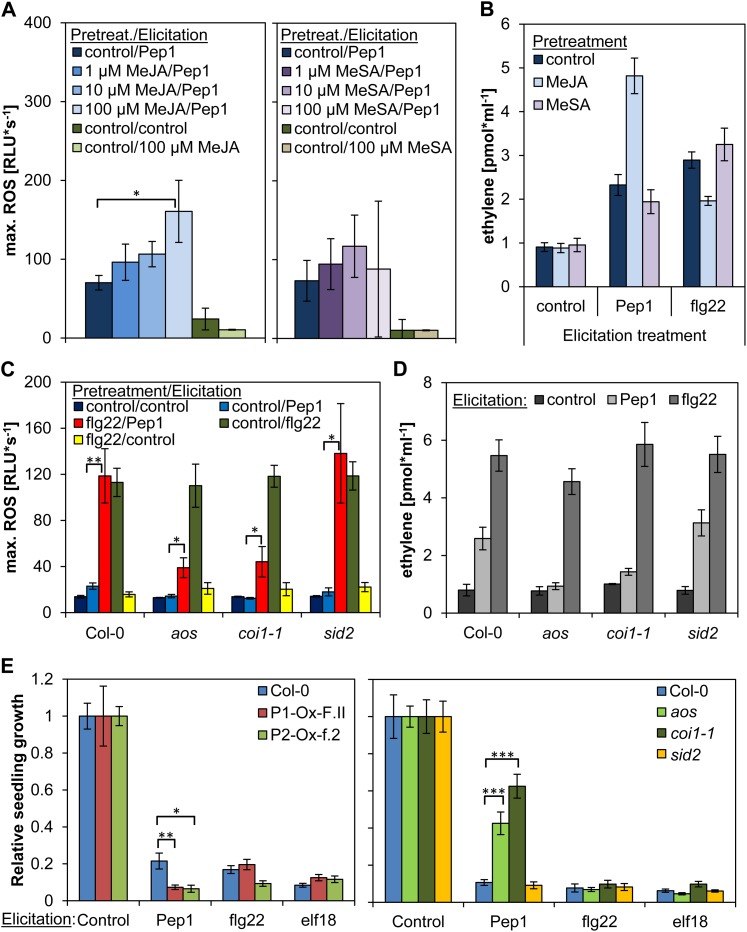
JA regulates AtPep-triggered responses. A, ROS production in Col-0. Leaf discs were either pretreated with indicated concentrations of MeJA (left) or MeSA (right) or without any hormone (control) for 16 h and then either treated with 1 µm AtPep1, 100 µm MeJA (left), 100 µm MeSA (right), or mock (control) as indicated. Columns represent averages of the peak values of ROS production of 12 biological replicates. B, Ethylene production in Col-0. Leaf strips were pretreated with the indicated concentrations of either MeJA or MeSA or mock (control) for 16 h and then treated with either 1 µm of AtPep1 or flg22 or mock (control) as indicated (elicitation) and incubated for 4 h before measurement. Columns represent the mean of six independent replicates. C, ROS production in aos, coi1-1, and sid2. Leaf discs of Col-0, aos, coi1-1, and sid2 mutant plants were pretreated with 1 µm flg22 or without any peptide (control) for 16 h and then treated with or without 1 µm of elicitor as indicated. Columns represent averages of the peak values of ROS production of 12 biological replicates. D, Ethylene production in aos, coi1-1, and sid2. Leaf strips of Col-0, aos, coi1-1, and sid2 mutant plants were incubated in water for 16 h and then treated with either 1 µm of AtPep1 or flg22 or without any peptide (control) and incubated for 4 h before measurement. Columns represent the mean of six independent replicates. E, Seedling growth inhibition. Five-day-old seedlings of the indicated genotypes were treated for 10 d with 1 µm of the indicated elicitor or without any peptide. Columns represent the mean weight of 12 seedlings out of six biological replicates. Error bars show se of the mean. Asterisks represent Student’s t test results (*P < 0.05, **P < 0.01, ***P < 0.001). RLU, Relative light units.

