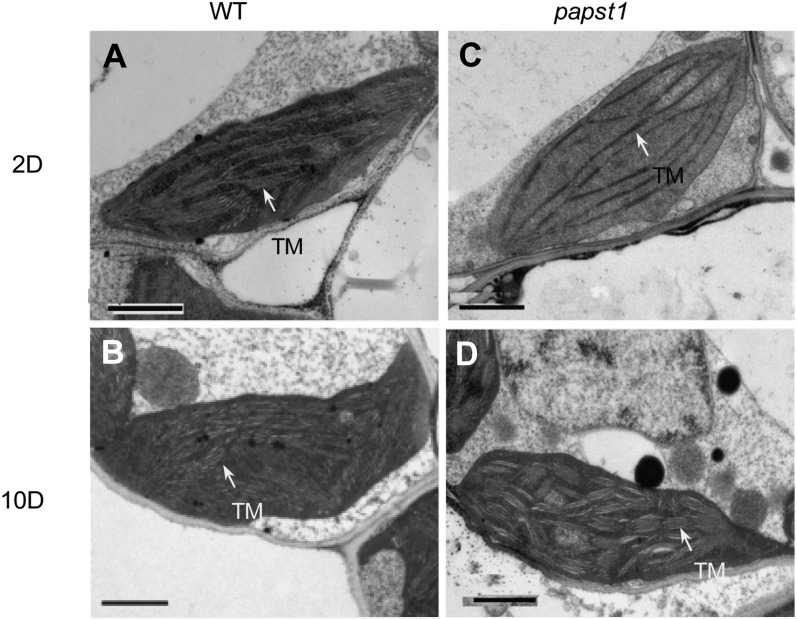
Figure 2.
TEM images of chloroplast structure in wild-type (WT) and papst1 mutant plants. Electron micrographs show the third leaf at 2 and 10 d after emerging in wild-type (A and B) and papst1 mutant (C and D) plants, respectively. Arrows indicate thylakoid membranes (TM). Bars = 1 µm.

