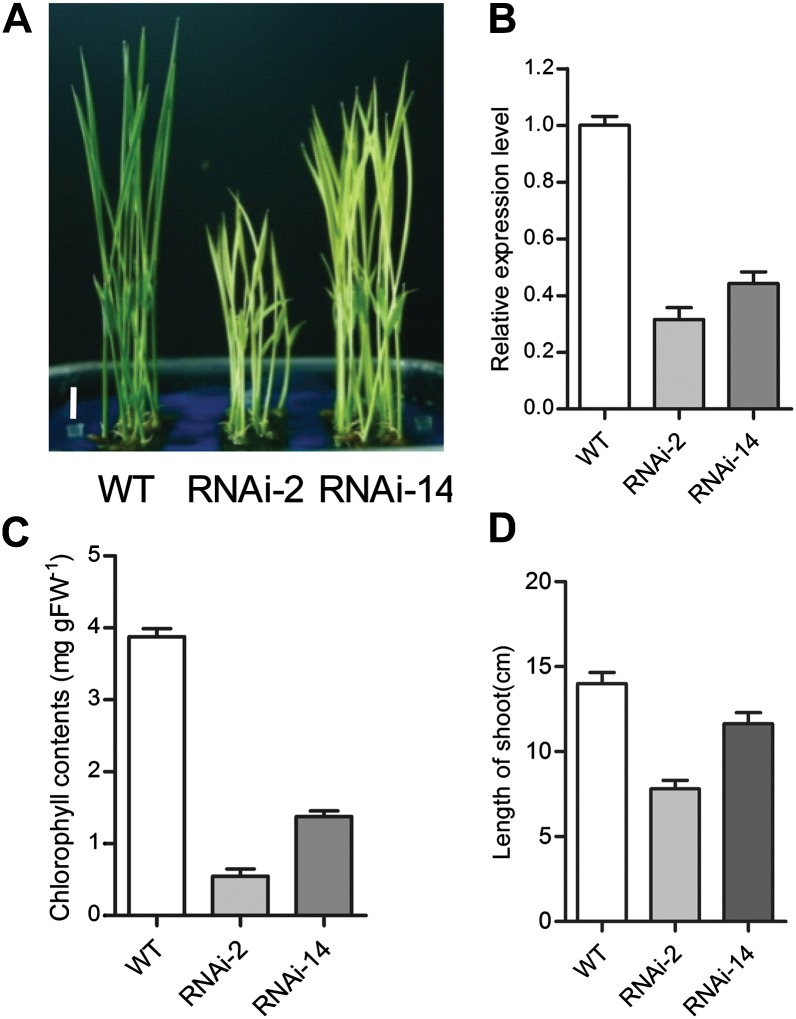
Figure 5.
Effects of RNAi suppression of OsPAPST1. A, Shoots of 7-d-old seedlings of RNAi lines. WT, Wild type. Bar = 1 cm. B, qRT-PCR analysis of the expression levels of OsPAPST1 in the third leaf of RNAi lines. C, Chlorophyll contents of the third leaf of 7-d-old wild-type and two RNAi plants. Values represent means ± sd of 10 biological replicates. FW, Fresh weight. D, Length of shoots of 7-d-old wild-type and two RNAi plants. Values represent means ± sd of five biological replicates.

