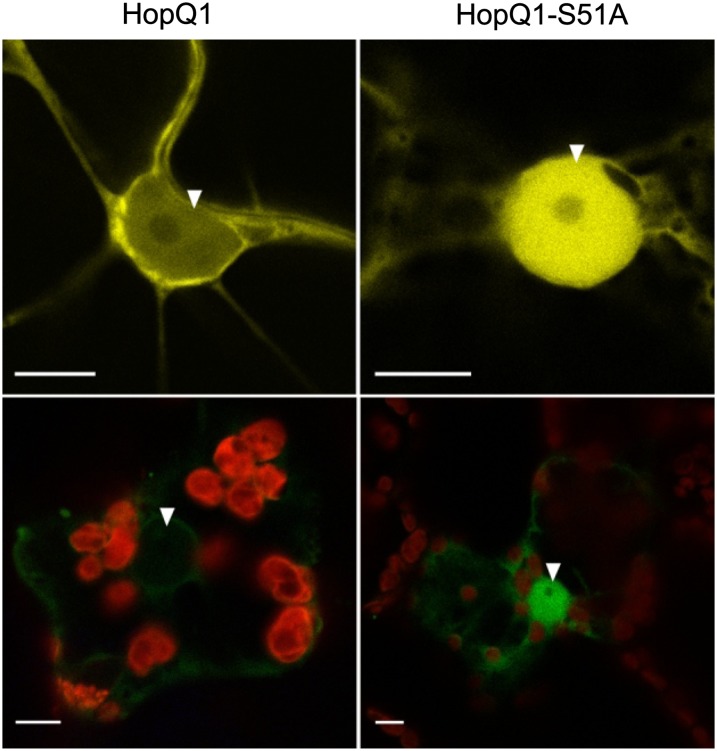
Figure 5.
Subcellular localization of HopQ1 variants. Confocal images show representative N. benthamiana leaf epidermal cells (top panels) or mesophyll cells (bottom panels) transiently expressing either wild-type HopQ1-eYFP (left panels) or HopQ1-S51A-eYFP (right panels). White arrowheads indicate the nuclei. The photographs were taken 72 h after agroinfiltration. For each variant, approximately 50 transformed cells were examined. Bars = 10 µm.

