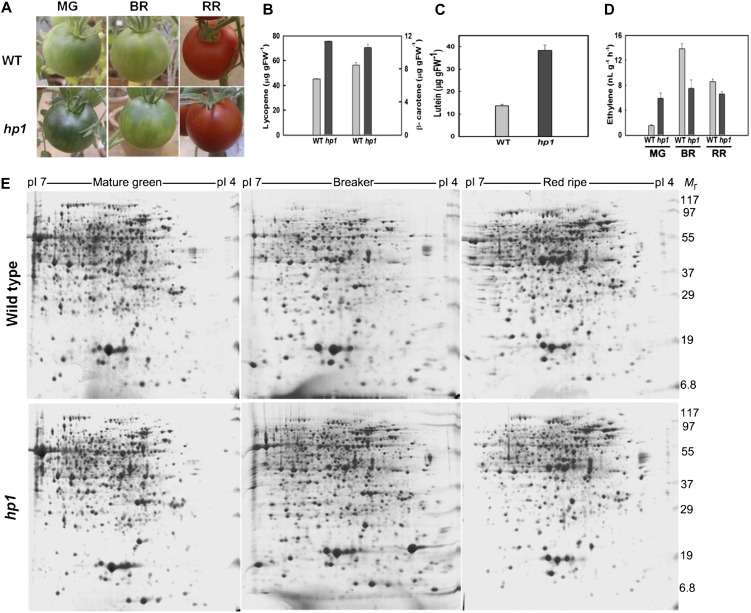
Figure 1.
Characterization of the phenotypic and metabolic differences between wild-type and hp1 fruits. A, Phenotypes of wild-type (WT) and hp1 fruits at MG, BR, and RR stages during ripening. B, Levels of lycopene (left) and β-carotene (right) in RR fruits of the wild type (WT) and hp1 (n > 3). C, Lutein levels in RR fruits of hp1 and the wild type (WT; n > 3). D, Ethylene emission from wild-type (WT) and hp1 fruits at different stages of ripening (n > 3). FW, Fresh weight. Error bars indicate se. E, Comparison of pericarp proteome profiles isolated from wild-type and hp1 fruits at MG, BR, and RR stages. Representative images from two-dimensional gel electrophoresis are shown. [See online article for color version of this figure.]

