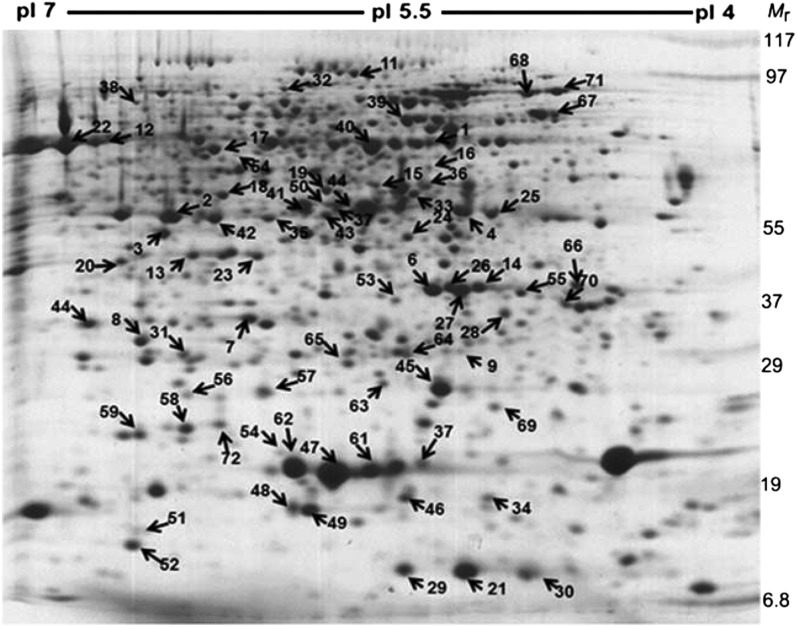
Figure 2.
A representative two-dimensional gel electrophoresis colloidal Coomassie blue-stained gel showing the profile of proteins extracted from hp1 fruits at the BR stage. The numbers indicate differentially expressed proteins that were later identified by mass spectrometry, and the arrows indicate their relative positions on the gel.

