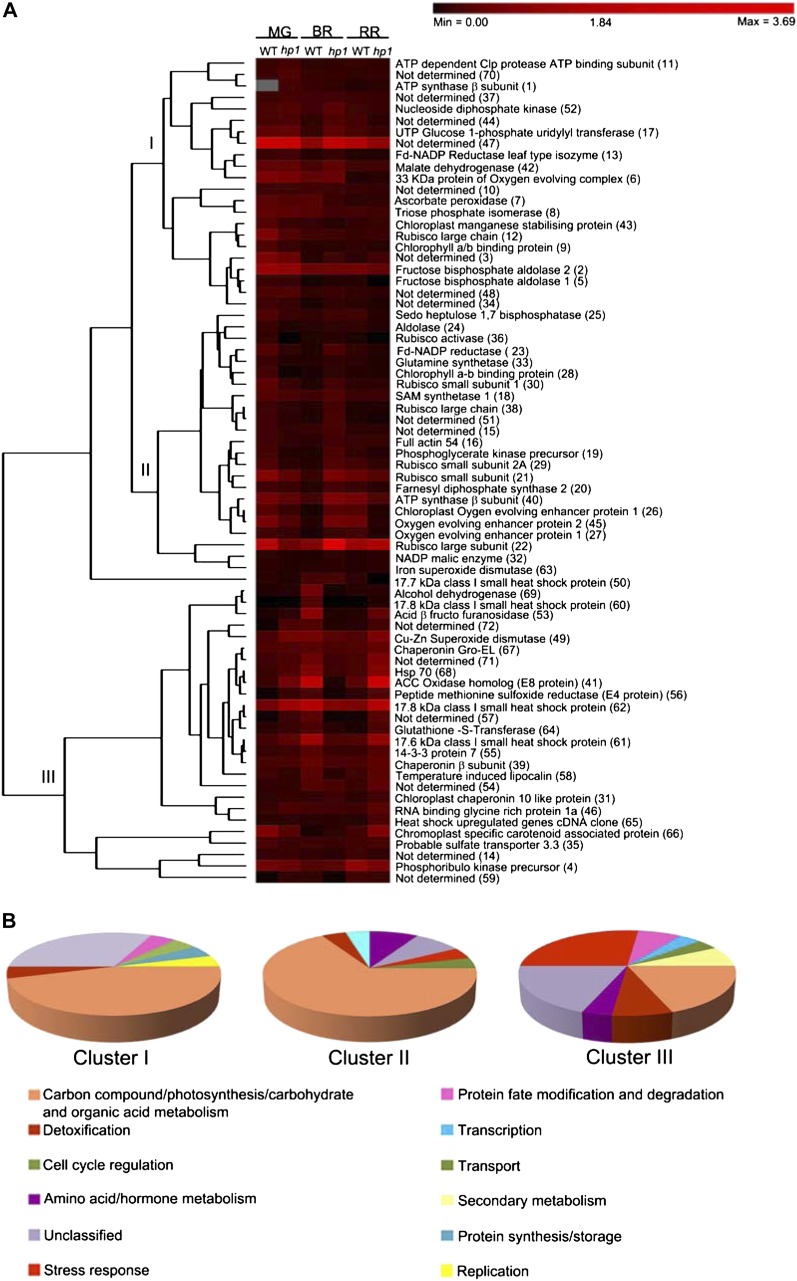
Figure 3.
Hierarchical clustering analysis of differentially expressed proteins in wild-type (WT) and hp1 fruits during ripening. A, Using PermutMatrix 1.9.3, proteins were clustered into three clusters based on their percentage spot volumes. A color bar corresponding to the relative levels of expression is given at the top of the heat map. The identity of each protein (spot no.) is indicated to the right of the rows. The columns represent levels of proteins at MG, BR, and RR stages of wild-type and hp1 fruits. B, Pie diagram showing the relative distribution of different functional classes of proteins in each cluster. [See online article for color version of this figure.]

