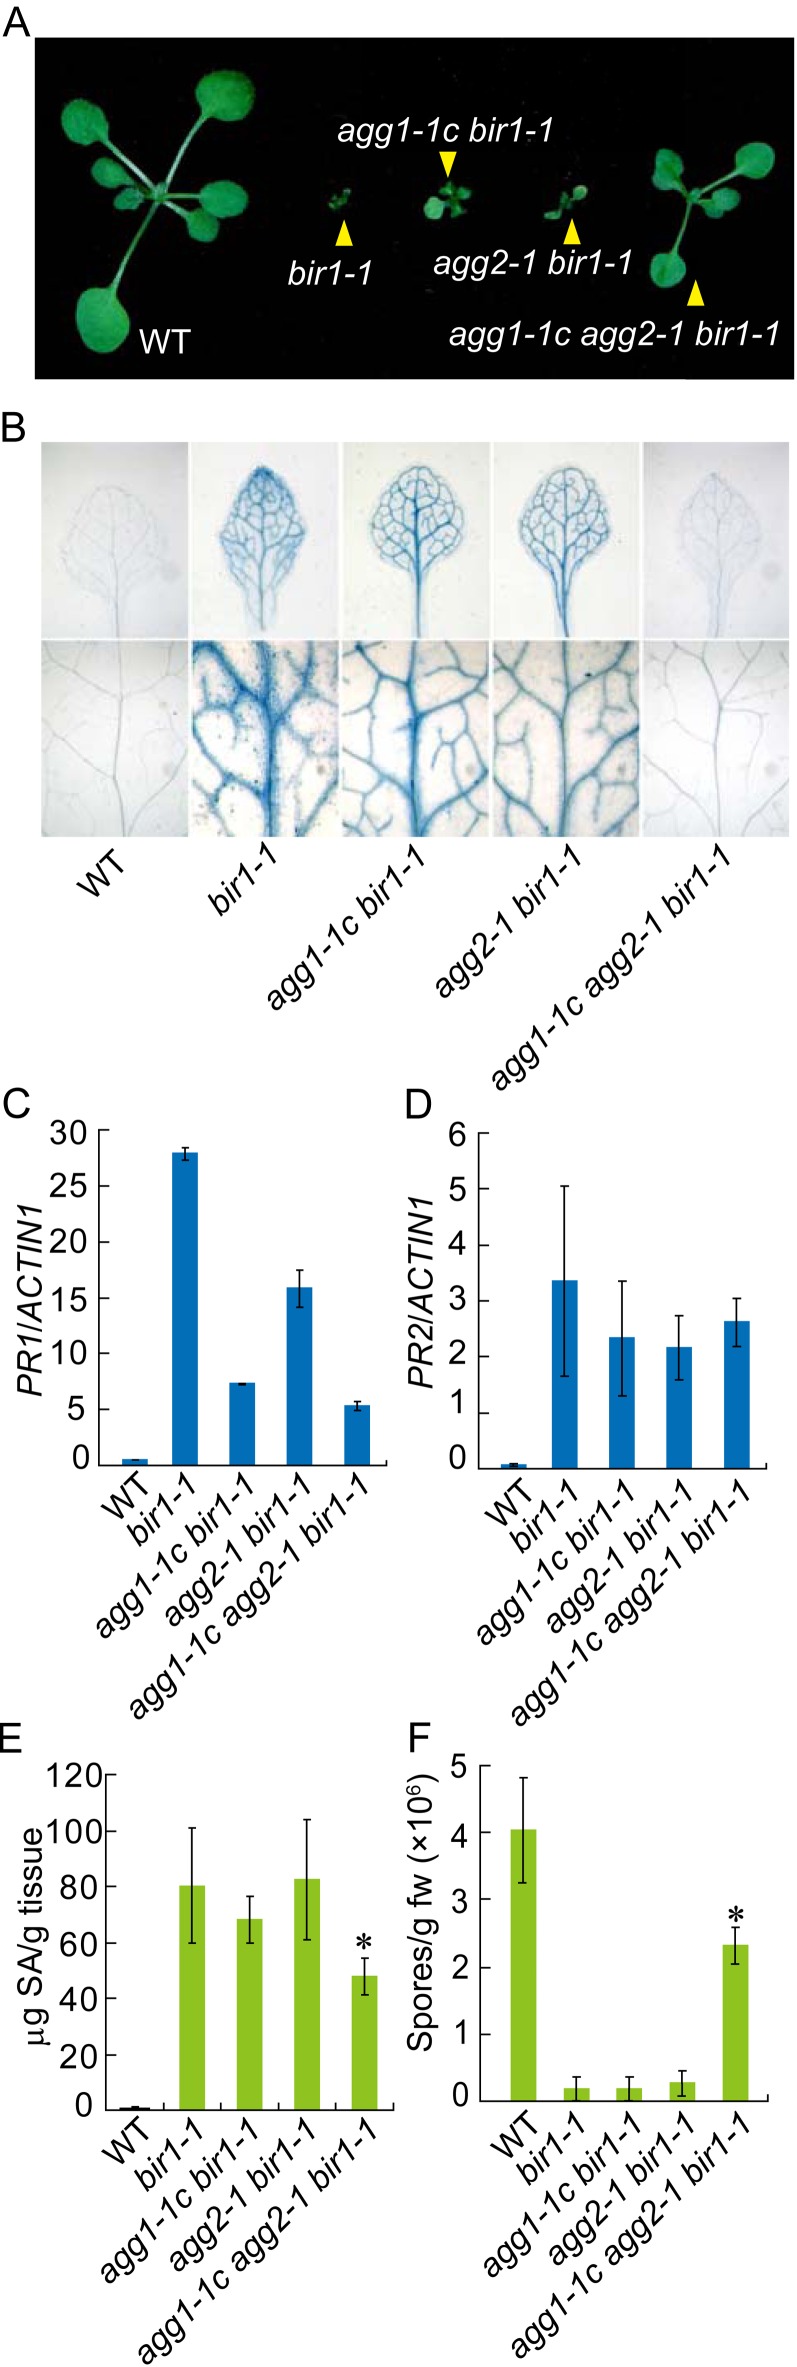
Figure 4.
Suppression of cell death and defense responses in bir1-1 by agg1-1c agg2-1. A, Morphology of wild-type, bir1-1, agg1-1c bir1-1, agg2-1 bir1-1, and agg1-1c agg2-1 bir1-1 plants. Plants were grown on soil at 23°C and photographed when they were about 3 weeks old. B, Trypan blue staining of the indicated genotypes. Plants were grown at 23°C for 2 weeks on one-half-strength MS plates. C to D, PR1 (C) and PR2 (D) expression in the indicated genotypes. Values were normalized to the expression of ACTIN1. Error bars represent sds from means of three measurements. E, SA levels in the indicated genotypes. Asterisks above the bars indicate significant difference from bir1-1 (*P < 0.01). F, Growth of H. arabidopsidis Noco2 on the indicated genotypes. Asterisks above the bars indicate significant difference from bir1-1 (*P < 0.001). WT, Wild type. [See online article for color version of this figure.]

