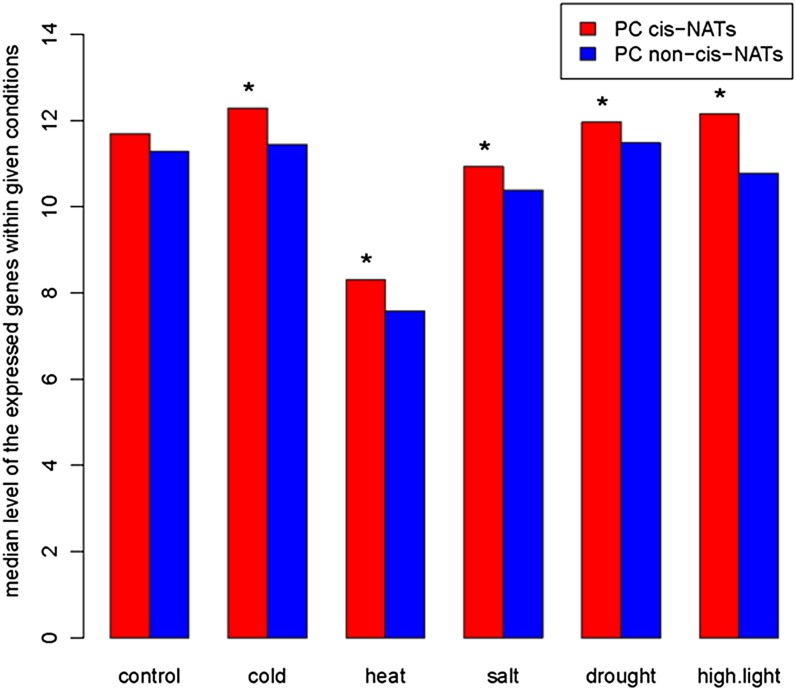
Figure 2.
Expressed PC cis-NATs accumulate to higher abundances than do expressed PC non-cis-NATs. The median expression levels of expressed PC cis-NATs and PC non-cis-NATs are noted on the y axis in RPKM for six growth conditions. Asterisks indicate that the median RPKM of expressed PC cis-NATs within a given condition is significantly greater than the median RPKM of expressed PC non-cis-NATs at P < 0.05. [See online article for color version of this figure.]

