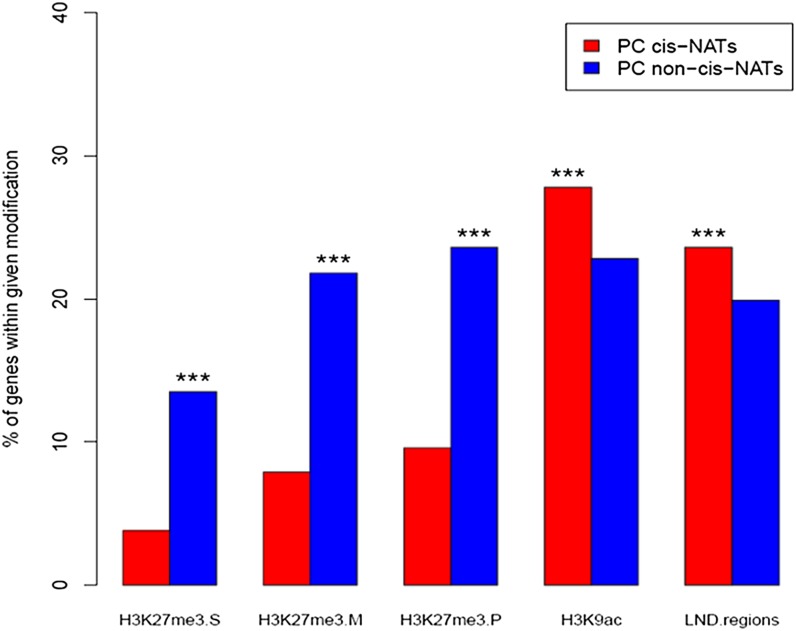
Figure 4.
Euchromatic marks are overrepresented in PC cis-NAT-encoding genes relative to PC non-cis-NAT-encoding genes. The proportions of PC cis-NAT-encoding genes and PC non-cis-NAT-encoding genes with distinct chromatin modifications are noted on the y axis. The abbreviations on the x axis are as follows: H3K27me3.S, trimethylation of histone H3K27 (Zhang et al., 2007); H3K27me3.M, trimethylation of histone H3K27 (Lafos et al., 2011); H3K27me3.P, the union of H3K27me3.S and H3K27me3.M; H3K9ac, acetylation of histone H3K9 (Zhou et al., 2010); LND regions, low-nucleosome-density regions (Zhang et al., 2007). Asterisks indicate that the proportion of PC cis-NAT (PC non-cis-NAT) genes with a given chromatin modification is significantly greater than the proportion of PC non-cis-NAT (PC cis-NAT) genes at P < 1e-03. [See online article for color version of this figure.]

