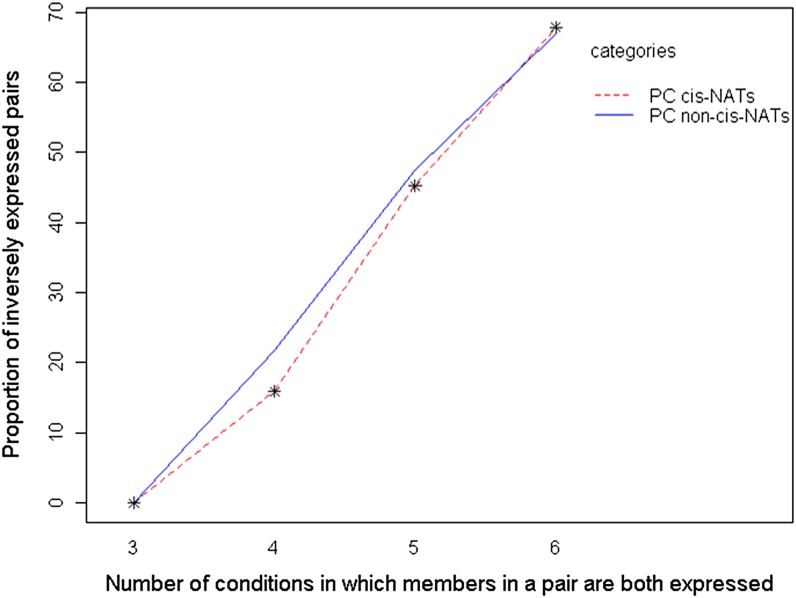
Figure 6.
Proportions of inversely expressed PC cis-NATs and PC non-cis-NATs at different expression breadths. The proportion of inversely expressed gene pairs is plotted against the number of conditions in which both members of a pair are present. The dotted line represents the observed proportion of inversely expressed PC gene pairs. The solid line represents the mean proportions of inversely expressed gene pairs from 10,000 data sets of randomly picked, expressed PC non-cis-NAT pairs. Asterisks indicate no significant difference between PC cis-NAT and PC non-cis-NAT values at P < 0.05. [See online article for color version of this figure.]

