

Abstract
Background
The contralateral femur frequently is used for preoperative templating for THA or hemiarthroplasty when the proximal femur is deformed by degenerative changes or fracture. Although femoral symmetry is assumed in these situations, it is unclear to what degree the contralateral femur is symmetrical.
Questions/purpose
We therefore defined the degree of asymmetry between left and right proximal femurs and determined whether it was affected by demographics and proximal femoral anatomy.
Methods
We obtained 160 paired femurs from individuals (20–40 years old), evenly distributed for gender and ethnicity (African-American and Caucasian). The height and weight of the individuals were recorded. We measured the femoral head diameter, minimal femoral neck diameter in the AP and cephalocaudal (CC) planes, and the AP femoral diaphyseal diameter. The absolute and percent differences were determined.
Results
All femoral measurements showed an absolute difference less than 2 mm and a percent asymmetry and difference less than 2% for the femoral head, less than 4% for the femoral neck, and less than 3.5% for the femoral shaft. We found no correlation or predictive value between absolute differences and asymmetry and age, ethnicity, gender, or weight. Height was negatively associated with femoral head differences and thus increased symmetry of the femoral head.
Conclusions
Our data support assumptions of substantial symmetry of the proximal femur and highlights that asymmetry is not affected by demographics or the size of the proximal femur. Asymmetry tends not to occur in isolated segments of the femur.
Introduction
The success of modern hip arthroplasty and development of the femoral prosthesis has driven research of the proximal femoral anatomy to help create the ideal hip replacement and improve surgical technique [5, 15, 27, 33]. This has led to research on the anatomic variability of the proximal femur which has discovered gender, ethnicity, and even bilateral femoral differences. Research on gender anatomic variations showed differences in femoral offsets and canal dimensions between males and females [2, 6, 29, 44]. Studies of ethnic variations of morphologic features of the femur showed differences in femoral head diameters, femoral offset, and shaft diameters between European and Asian populations [18, 43]. Research on bilateral femoral asymmetry has focused on properties such as bone mineral density, mechanical strength, cortex thickness, torsion angles, limb lengths, or the distal femur [8, 26, 28, 32, 36, 40]. The studies that have researched asymmetry between proximal femoral dimensions such as the femoral head diameter have a small sample size [28] or do not take into account age, gender, or arthritic deformities [3].
There is a frequent clinical assumption that there is minimal bilateral asymmetry between proximal femurs. Preoperative templating of radiographs before hip arthroplasty helps the surgeon anticipate correct implant positioning and predict implant size and potential difficulties [4, 11, 16, 25, 34]. In severely arthritic hips, the anatomy may be difficult to discern, or the affected leg may be externally rotated. In this situation, templating the affected hip would underestimate femoral offset and leg length discrepancy (LLD), and thus the unaffected contralateral hip often is templated instead [9, 10, 17, 34, 46]. LLD is monitored as a complication for hip arthroplasty owing to its association with patient dissatisfaction and litigation after hip arthroplasty [19, 23, 24, 30]. When templating the contralateral hip before hemiarthroplasty for femoral neck fractures, Suh et al. showed that taking into account joint cartilage less than 2 mm showed statistically better LLD and femoral head offsets [39]. Without data on baseline femoral asymmetry, it is unclear if small adjustments for femoral head sizes on templating could affect LLD or at least confound studies that use LLD as a measure of successful surgery.
Asymmetry also is used to identify some pathological states such as coxa magna. Coxa Magna is a sequela of pediatric hip disorders such as Legg-Calvé-Perthes disease and transient synovitis [1, 13, 14, 21]. It has been defined frequently in the literature as circumferential enlargement of the studied femoral head when compared with the contralateral or unaffected hip [14, 21, 24, 37]. This definition assumes a bilateral symmetry of the hips. However, coxa magna and the diseases that cause it often may affect both hips and therefore endanger that assumption. Quantitative definitions of coxa magna in the literature were developed arbitrarily without using healthy control subjects and without knowledge of baseline hip symmetry [14, 17, 21, 37]. These definitions continue to be used despite there being evidence to suggest that the magnitude of coxa magna is correlated with increased Iowa hip ratings and requirement of arthroplasty [24]. By defining the normal distribution of symmetry in the hip, this study will help quantify the limits of normal variance and thus better define coxa magna.
Thus, the objectives of this study were: (1) to determine the normal distribution of absolute and percent differences between the left and right proximal femur measurements to define normal asymmetry; (2) to determine if asymmetry between bilateral femurs was correlated with demographic variables, such as gender, ethnicity, height, and weight; and (3) to assess whether there were correlations between the amount of asymmetry and absolute femoral measurements.
Materials and Methods
We obtained 160 paired cadaveric femurs from the Hamann-Todd Human Osteological Collection housed at the Cleveland Museum of Natural History in Cleveland, Ohio, USA. This osteologic collection is the largest modern collection of documented human skeletons in the world, with more than 3100 human skeletons. The skeletons in this collection were obtained as unclaimed bodies and dissecting room cadavers in Cleveland, Ohio, between 1912 and 1938 [7]. Specimens from this collection include documented height and weight at the time of death, and gender and ethnic origin. From the 3100 specimens, we selected only those between 20 to 30 and 30 to 40 years old at the time of death. We divided the specimens into gender and ethnic groups (Caucasian male and female, African-American male and female), creating a total of eight groups. We then selected 20 pairs of femurs from the above groups that were at the extremes of heights for each group. This was done to ensure that the complete range of femoral sizes in the sample groups was used. We excluded specimens with only one femur or femurs with evidence of osseous degeneration, defects, or gross disorders, or any pair of femurs whose age, weight, height, ethnicity, and gender could not be confirmed. This relatively young population aided in minimizing the likelihood of arthritic processes that contributed to morphologic features of the bone. Demographic data pertaining to age, gender, ethnicity, and height of the 160 specimens were documented (Table 1). The overall average age of the sample cohort was 31 years. The average height was 167 cm and the average weight was 55 kg.
Table 1.
Demographic data
| Variable | Male | Female | ||
|---|---|---|---|---|
| Black (n = 40) | White (n = 40) | Black (n = 40) | White (n = 40) | |
| Average age* (years) | 31 ± 6 | 32 ± 6 | 31 ± 6 | 32 ± 6 |
| Average height* (cm) | 176 ± 16 | 170 ± 15 | 163 ± 11 | 159 ± 11 |
| Average weight* (kg) | 57 ± 12 | 62 ± 15 | 48 ± 13 | 54 ± 13 |
* The data are given as mean ± SD.
We used a previously described measurement method [22, 42, 44, 45] involving the Hamann-Todd Human Osteological Collection. Each of the specimens was digitally photographed in two standardized positions, termed AP and cephalocaudal (CC). For AP photographs, each femur pair was placed in a supine position on a flat laboratory bench with anterior surfaces directed toward the ceiling and femoral shafts parallel to one another. In this position, specimens rested distally on the convex surfaces of the medial and lateral condyles and proximally on the greater trochanter. The femoral neck then was made parallel to the superior surface of the laboratory bench and along the vertical axis, as determined by visual inspection via elevation or support of the medial or lateral condyles. AP photographs were taken from directly overhead (the camera lens was parallel to the laboratory bench and the femoral neck axis, as confirmed by a level). By taking photographs from this overhead position, accurate AP pictures were obtained.
For the CC photographs, each femur pair was placed on the bench surface with anterior surfaces facing up and both condyles in contact with the bench. The femurs then were abducted until the femoral necks were parallel to the edge of the bench, as determined by visual inspection. The camera lens was parallel to the edge of the laboratory bench (as confirmed using a T-square ruler). The CC plane is a plane developed by the superior surface of the femoral neck and thus is orthogonal to the AP view of the neck. Differences in the mean femoral head diameters between the two views does not suggest that the femoral head is noncircular, only that the diameter measured from the CC view represents a portion of the femoral head that is available to be measured from that perspective.
ImageJ software (http://imagej.nih.gov/ij/; National Institutes of Health, Bethesda, MD, USA) was used to obtain measurements from each specimen. All measurements were made by two investigators (EYY, JG). Measurements of distance from the photographs initially were recorded in units of pixels. Each photograph had a standard metric ruler at the same level as the femoral sample, which enabled conversion of pixels into millimeters. Interobserver and intraobserver reliabilities for the measurement procedure were determined by calculating the intraclass correlation coefficient (ICC). Interobserver reliability was calculated by both observers (EYY, JG) completing all 160 sets of femurs independently using the same method. Intraobserver reliability was calculated for both observers (EYY, JG) by a repeat of 40 randomly selected femur sets (left and right femurs, femoral diameter and minimum neck diameter) with an interval greater than 4 weeks apart. This analysis showed reproducibility with high interobserver ICC values (> 0.99) and intraobserver ICC values (> 0.93). Only one complete measurement set was used (EYY) for the purpose of analysis.
The following measurements were obtained from AP images: (1) femoral head diameter; (2) minimal neck diameter; and (3) shaft diameter (Fig. 1). The measurements that were obtained from CC images were the femoral head diameter and the minimal neck diameter (Fig. 2). The femoral head diameter was measured by fitting a perfect circle to the femoral head and picking the best-fit circle by which the femoral head did not extend more than 1 mm outside the outline the circle. Minimal neck diameter was obtained by determining and marking the axis of the femoral neck and subsequently finding a line orthogonal to the axis that represented the shortest distance between the superior and inferior aspects of the neck. The femoral shaft diameter was obtained by drawing a line that began at the inferior portion of the lesser trochanter and was perpendicular to the femoral shaft axis. Absolute differences were obtained by subtracting the result of the smaller of the specimens (left or right) from the result of the larger. Percent absolute asymmetry or percent difference was determined using the following documented method: percent asymmetry = (maximum − minimum)/(average of maximum and minimum) × 100 [3]. This variable was used to define the magnitude of asymmetry.
Fig. 1.
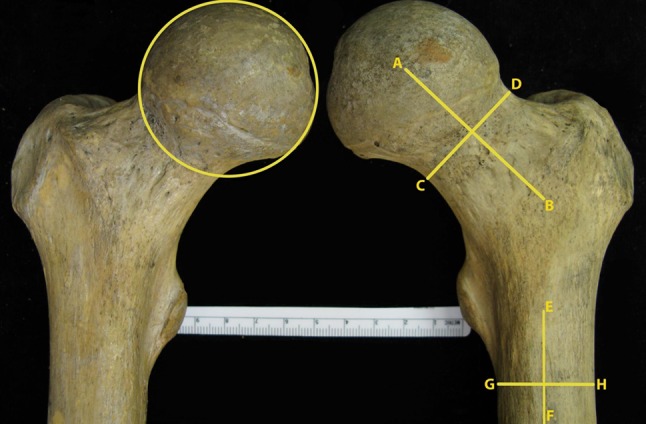
An AP view of a pair of femurs is shown. The femoral diameter is shown as the best-fit circle on the femoral head. The minimal neck diameter was defined as the minimal distance about the neck perpendicular to the neck axis. Line AB represents the neck axis. Line CD represents the minimal neck diameter. The shaft diameter was defined as the diameter of a line drawn from the last visible inferior portion of the lesser trochanter tangential to the shaft axis. Line EF represents the femoral shaft axis. Line GH represents the shaft diameter.
Fig. 2.
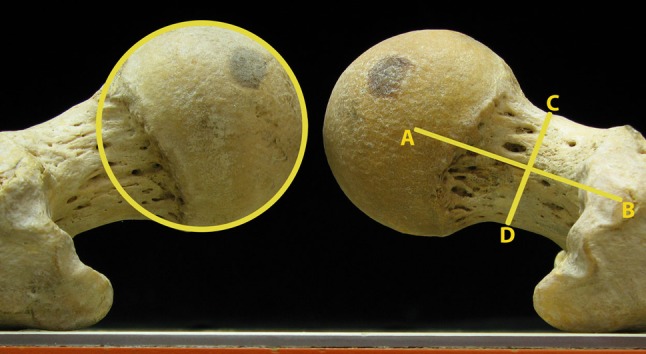
A cephalocaudal view of a pair of femurs is shown. The femoral head diameter was defined as the diameter of the best-fit circle on the femoral head shown here. The minimal neck diameter was defined as the minimal distance about the neck perpendicular to the neck axis. Line AB represents the neck axis. Line CD represents the minimal neck diameter.
Means and standard deviations were determined for each of the measurements made for the population as a whole and for various subpopulations, based on gender and race. Normal (Gaussian) distributions of the absolute differences and percent asymmetry between pairs of femora were determined for the sample population as a whole. Univariate analysis was performed using t-tests. Pearson’s coefficients were calculated to examine correlations among absolute differences, specimen demographic data, and femoral measurements. A multiple regression model was performed that compared absolute AP head diameter differences with all specimen demographic data (age, ethnicity, height, weight, gender) and osseous measurements. Multiple linear regression models were developed to establish the determinants for each of the variables that defined a difference between left and right. For each model, variables with a p value less than 0.1 were kept in the final model. Stepwise backward and forward variable selection was performed on the multiple regression models to confirm that the same variables were selected for all outcomes. Statistical analyses were performed using Statgraphics® Centurion XV (Version 15.2, Statpoint Technologies Inc, Warrenton, VA, USA).
Results
No absolute difference of any femoral measurement exceeded 1.5 mm at the 95% confidence interval, with all distributions falling between 0.3 mm and 1.4 mm (Table 2). The percent asymmetry did not exceed 4% for all femoral measurements, with all 95% confidence intervals falling between 1.1% and 4.1%.
Table 2.
Measurements of proximal femoral anatomy, absolute differences, and percent asymmetry per gender
| Measurement | Gender | Diameter* (mm) | 95% CI | Absolute difference*,† (mm) | 95% CI | Percent asymmetry‡ | 95% CI |
|---|---|---|---|---|---|---|---|
| AP measurements | |||||||
| Femoral head | Male | 55.8 ± 4.3 | (54.8, 56.7) | 0.8 ± 0.7 | (0.5, 1.1) | 1.5 ± 1.4 | (1.2, 1.8) |
| Female | 48.3 ± 3.1 | (47.6, 49.0) | 0.9 ± 0.7 | (0.6, 1.1) | 1.8 ± 1.4 | (1.5, 2.1) | |
| Femoral neck | Male | 39.3 ± 4.1 | (38.4, 40.3) | 1.1 ± 0.7 | (0.8, 1.4) | 2.9 ± 1.9 | (2.5, 3.3) |
| Female | 33.7 ± 2.7 | (33.1, 34.3) | 1.0 ± 0.8 | (0.7, 1.4) | 3.1 ± 2.4 | (2.6, 3.6) | |
| Femoral shaft | Male | 37.0 ± 3.8 | (36.1, 37.8) | 1.1 ± 0.8 | (0.7, 1.4) | 2.9 ± 2.2 | (2.4, 3.4) |
| Female | 33.3 ± 3.2 | (32.6, 34.0) | 0.9 ± 0.7 | (0.6, 1.2) | 2.7 ± 2.0 | (2.3, 3.2) | |
| Cephalocaudal measurements | |||||||
| Femoral head | Male | 40.6 ± 3.2 | (39.9, 41.3) | 0.6 ± 0.6 | (0.3, 0.8) | 1.4 ± 1.4 | (1.1, 1.7) |
| Female | 35.2 ± 2.3 | (34.7, 35.7) | 0.5 ± 0.4 | (0.3, 0.7) | 1.4 ± 1.2 | (1.1, 1.6) | |
| Femoral neck | Male | 23.9 ± 2.5 | (23.9, 24.5) | 0.8 ± 0.6 | (0.5, 1.0) | 3.2 ± 2.4 | (2.6, 3.7) |
| Female | 20.1 ± 1.9 | (19.6, 20.5) | 0.7 ± 0.6 | (0.4, 0.9) | 3.5 ± 2.9 | (2.8, 4.1) | |
* The data are given as mean ± SD; †absolute difference = difference between maximum and minimum of left and right; ‡percent asymmetry = (maximum − minimum)/(average of maximum and minimum) × 100.
We found no association between absolute differences or percent asymmetry and gender (Table 3) and ethnicity (Table 4). Age or weight was not associated with any absolute differences or percent asymmetry on univariate analysis (Table 5). Height negatively correlated with AP femoral head absolute difference (r = −0.20; p = 0.02) and percent asymmetry (r = −0.25; p = 0.001) indicating that increased height was associated with increased femoral head symmetry. Height was associated (r2 = 0.11; p = 0.02) with AP femoral head difference.
Table 3.
Measurements of proximal femoral anatomy, absolute differences, and percent asymmetry per ethnicity
| Measurement | Ethnicity | Diameter* (mm) | 95% CI | Absolute difference*,† (mm) | 95% CI | Percent asymmetry‡ | 95% CI |
|---|---|---|---|---|---|---|---|
| AP measurements | |||||||
| Femoral head | Caucasian | 52.0 ± 4.7 | (50.9, 53.0) | 1.0 ± 0.8 | (0.8, 1.1) | 1.9 ± 1.7 | (1.5, 2.3) |
| African-American | 52.1 ± 5.9 | (50.8, 53.4) | 0.7 ± 0.5 | (0.6, 0.8) | 1.4 ± 1.1 | (1.2, 1.7) | |
| Femoral neck | Caucasian | 36.6 ± 4.2 | (35.7, 37.5) | 1.2 ± 0.8 | (1.0, 1.4) | 3.4 ± 2.4 | (2.9, 3.9) |
| African-American | 36.4 ± 4.8 | (35.4, 37.5) | 1.0 ± 0.7 | (0.8, 1.1) | 2.7 ± 2.0 | (2.7, 3.2) | |
| Femoral shaft | Caucasian | 35.0 ± 3.8 | (34.1, 35.8) | 1.0 ± 0.8 | (0.8, 1.1) | 2.8 ± 2.2 | (2.3, 3.3) |
| African-American | 35.3 ± 4.1 | (34.4, 36.2) | 1.0 ± 0.7 | (0.8, 1.2) | 2.8 ± 2.0 | (2.4, 3.2) | |
| Cephalocaudal measurements | |||||||
| Femoral head | Caucasian | 37.5 ± 3.3 | (36.8, 41.3) | 0.6 ± 0.5 | (0.4 0.7) | 1.5 ± 1.5 | (1.2, 1.8) |
| African-American | 38.2 ± 4.4 | (37.3, 39.2) | 0.5 ± 0.4 | (0.4, 0.6) | 1.3 ± 1.1 | (1.0, 1.5) | |
| Femoral neck | Caucasian | 21.6 ± 2.4 | (21.1, 22.1) | 0.7 ± 0.6 | (0.6, 0.9) | 3.5 ± 2.9 | (2.8, 4.1) |
| African-American | 22.4 ± 3.4 | (21.7, 23.2) | 0.7 ± 0.5 | (0.5, 0.6) | 3.2 ± 2.4 | (2.7, 3.7) | |
* The data are given as mean ± SD; †absolute difference = difference between maximum and minimum of left and right; ‡percent asymmetry = (maximum − minimum)/(average of maximum and minimum) × 100.
Table 4.
Results of univariate analysis
| Measurement | Gender p values |
Ethnic group p values |
|---|---|---|
| AP head diameter | < 0.001 | 0.88 |
| Absolute difference | 0.70 | 0.02 |
| Percent asymmetry | 0.57 | 0.02 |
| AP neck diameter | < 0.001 | 0.82 |
| Absolute difference | 0.45 | 0.07 |
| Percent asymmetry | 0.57 | 0.06 |
| AP shaft diameter | < 0.001 | 0.67 |
| Absolute difference | 0.20 | 0.94 |
| Percent asymmetry | 0.70 | 0.88 |
| CC head diameter | < 0.001 | 0.24 |
| Absolute difference | 0.34 | 0.39 |
| Percent asymmetry | 0.89 | 0.26 |
| CC neck diameter | < 0.001 | 0.07 |
| Absolute difference | 0.48 | 0.83 |
| Percent asymmetry | 0.45 | 0.54 |
CC = cephalocaudal.
Table 5.
Correlations between proximal femoral measurements, absolute differences, percent asymmetries and demographic data of age, height and weight
| Measurement | Age | Height | Weight | |||
|---|---|---|---|---|---|---|
| R value | p value | R value | p value | R value | p value | |
| AP head diameter | 0.01 | 0.87 | 0.72 | < 0.001 | 0.50 | < 0.001 |
| Absolute difference | 0.01 | 0.87 | −0.20 | 0.02 | 0.00 | 0.92 |
| Percent asymmetry | 0.02 | 0.79 | −0.25 | 0.001 | −0.03 | 0.69 |
| AP neck diameter | 0.01 | 0.87 | 0.72 | < 0.001 | 0.51 | < 0.001 |
| Absolute difference | −0.05 | 0.54 | −0.02 | 0.77 | 0.11 | 0.16 |
| Percent asymmetry | −0.05 | 0.52 | −0.15 | 0.06 | 0.01 | 0.81 |
| AP shaft diameter | 0.08 | 0.30 | 0.67 | < 0.001 | 0.49 | < 0.001 |
| Absolute difference | −0.09 | 0.25 | 0.10 | 0.20 | 0.02 | 0.77 |
| Percent asymmetry | −0.10 | 0.21 | 0.00 | 0.92 | −0.05 | 0.52 |
| CC head diameter | 0.04 | 0.59 | 0.74 | < 0.001 | 0.43 | < 0.001 |
| Absolute difference | 0.03 | 0.69 | −0.06 | 0.43 | 0.06 | 0.47 |
| Percent asymmetry | 0.02 | 0.81 | −0.13 | 0.10 | 0.02 | 0.82 |
| CC neck diameter | 0.07 | 0.41 | 0.67 | < 0.001 | 0.37 | < 0.001 |
| Absolute difference | −0.04 | 0.58 | 0.00 | 0.96 | 0.00 | 0.96 |
| Percent asymmetry | −0.05 | 0.57 | −0.11 | 0.14 | −0.06 | 0.49 |
CC = cephalocaudal.
We found a relationship between AP femoral head absolute difference and AP shaft diameter (r = −0.16; p = 0.05) and AP shaft absolute difference and AP femoral head diameter (r = 0.16; p = 0.04) (Table 6). The analysis of the AP absolute differences measurements showed that there were correlations between contiguous parts of the proximal femur (femoral head to neck: r = 0.17, p = 0.03; femoral neck to shaft: r = 0.16. p = 0.04) but no correlations between contiguous segments (femoral head to shaft: r = −0.01, p = 0.88). The femoral neck is in direct contact with the femoral head and femoral shaft and its absolute differences correlated with those of the femoral head and shaft (Table 6). In the CC view only the femoral head and neck dimensions were measured and their absolute differences showed positive correlations (Table 6). Absolute differences of the same femoral dimension in two views (AP and CC) were positively correlated. For example, the AP and CC femoral head differences (r = 0.28; p < 0.001) and the AP and CC femoral neck differences were correlated (r = 0.19; p = 0.02). Absolute differences were associated only with measurements in the adjacent view (AP versus CC) with AP and CC femoral head (r2 = 0.11; p < 0.001) and AP and CC femoral neck (r2 = 0.04; p = 0.02).
Table 6.
Correlations between femoral measurement differences and dimensions
| Measurement | Variable | Pearson’s coefficient (r) | p value |
|---|---|---|---|
| AP head difference | AP neck difference | 0.17 | 0.03 |
| AP shaft diameter | −0.16 | 0.05 | |
| CC head difference | 0.28 | < 0.001 | |
| AP neck difference | AP head difference | 0.17 | 0.03 |
| AP shaft difference | 0.16 | 0.04 | |
| CC head difference | 0.16 | 0.04 | |
| CC neck difference | 0.19 | 0.02 | |
| AP shaft difference | AP head diameter | 0.16 | 0.04 |
| AP neck difference | 0.16 | 0.04 | |
| CC head difference | AP head difference | 0.28 | < 0.001 |
| AP neck difference | 0.16 | 0.04 | |
| CC neck difference | 0.18 | 0.03 | |
| CC neck difference | AP neck difference | 0.19 | 0.02 |
| CC neck difference | 0.19 | 0.02 | |
| CC head difference | 0.18 | 0.03 |
CC = cephalocaudal.
Multivariable linear regression analysis showed no correlations between absolute differences and demographic data of height, weight, age, sex, or ethnicity (Table 7).
Table 7.
Results of multiple regressions of difference variables
| Model variable | Variable | Estimate | p value | r2 |
|---|---|---|---|---|
| AP head difference | Height (cm) | −0.01* | 0.02 | 0.11 |
| CC head difference | 0.38 | < 0.01 | ||
| AP neck difference | CC neck difference | 0.26 | 0.02 | 0.04 |
| AP shaft difference | AP neck difference | 0.15 | 0.04 | 0.03 |
| CC head difference | AP head difference | 0.20 | < 0.01 | 0.08 |
| CC neck difference | AP neck difference | 0.14 | 0.02 | 0.04 |
* Negative estimates indicate that as the estimate variable increases the model variable decreases; CC = cephalocaudal.
Discussion
Proximal femoral anatomy has been the subject of numerous studies owing to the success of hip arthroplasty worldwide [5, 6, 15, 18, 31, 43], and as a result of the discovery that certain femoral disorders, such as femoral acetabular impingement and Legg-Calvé-Perthes disease, can lead to osteoarthritis [1, 11, 13, 41]. The investigators who have examined symmetry have studied bone properties and cortex thickness [28, 32, 36, 40], with few studying dimensions [3, 28]. The clinical impact of asymmetry is subtle, as the assumption of symmetry is pervasive. Preoperative templating for arthroplasty of a severely deformed hip often is performed on the contralateral side under the assumption that it is symmetric to the predeformed morphologic features of the hip undergoing treatment [9, 10, 17, 34, 46]. Calculations to determine hip offset, implant size, LLD, and femoral osteotomy level are made on the contralateral hip. Asymmetry data also may allow clinicians to determine if baseline asymmetry is negligible enough to allow them to use the contralateral hip as a guide rather than rely on intraoperative markers on the deformed hip [35, 37, 46]. Additionally, coxa magna, a sequela of pediatric hip disorders, is defined as an asymmetric enlargement of the femoral head and neck [1, 13, 14, 21, 37], with quantitative definitions made arbitrarily [14, 37]. Knowledge of baseline symmetry will help quantitatively define the disorder, differentiate it from normal, and help monitor disease progression. We therefore: (1) measured the proximal femoral anatomy and determined the normal distribution of gross measurements and absolute differences between the left and right femurs; (2) determined if these dimensional values and absolute differences between bilateral femurs had any association with demographic variables; and (3) assessed whether any correlations existed among the amount of asymmetry measured, demographic data, and other femoral measurements.
Our study has some limitations. First, the specimens came from a collection that is nearly 100-years-old, and thus, these individuals lived in an era when untreated bony abnormalities had a higher prevalence. The lifestyles, nutritional intakes, and average height and weight of these individuals differ from contemporary populations, and this may have affected the generalization of these data. A second limitation was that we measured anatomic landmarks, using digital analyses of photographs, and thus, the measurements may differ from the measurements made on the specimens by using calipers or in the clinical setting, using radiographic imaging. This limitation was mitigated by using a systematic method and high-resolution pictures (degree of error < 1 mm), and by using a projection that is used clinically (AP). Additionally, the measured asymmetry of the femoral head in this study falls within that reported in the literature (Table 8) [3, 21, 28, 45].
Table 8.
Comparison of AP femoral head diameters and differences reported in the literature
| Study | Femoral head diameter (mm) | Absolute difference (mm) |
|---|---|---|
| Asala [2] | WM, 48.4 ± 2.6 WF, 42.3 ± 2.4 AM, 44.5 ± 2.5 AF, 39.8 ± 2.1 |
ND |
| Ellis et al. [12] | 47.2 | ND |
| Hoaglund and Low [18] | WM, 46 WF, 43 CM, 45 CF, 40 |
ND |
| Kallio [21] | 0.1 ± 0.9 | |
| Noble et al. [27] | 46.1 ± 4.8 | ND |
| Pierre et al. [28] | 46 | 0 ± 2 |
| Rawal et al. [31] | IM, 48.2 ± 2.3 IF, 42.3 ± 2.0 |
ND |
| Rubin et al. [33] | 43.4 ± 2.6 | ND |
| Sugano et al. [38] | 44.9 ± 4.3 | ND |
| Umer et al. [43] | 50.1 ± 3.8 | ND |
| Unnanuntana et al. [45] | M, 55.5 ± 3.2 F, 48.7 ± 2 Mean, 52.1 ± 4.4 |
0.9 ± 0.8 |
| Current study | M, 55.8 ± 4.3 F, 48.3 ± 3.1 Mean, 52.0 ± 5.3 |
0.8 ± 0.7 |
Data are given as mean ± SD; M = male; F = female; WM = white male; WF = white female; AM = black male; AF = black female; CM = Chinese male; CF = Chinese female; IM = Indian male; IF = Indian female; ND = measurements were not done in this particular study.
The AP femoral head diameter absolute difference in this study was comparable to values reported in the literature (Table 8). In a study on bipolar hemiarthroplasty for femoral neck fractures, Suh et al. used the contralateral hip as a preoperative template and showed that by taking into account the acetabular cartilage and adjusting the femoral osteotomy level accordingly, there was a statistical improvement in LLD [39]. Suh et al. measured the distance between the bony acetabulum and femoral head in the AP view, and determined that the mean acetabular cartilage was 2 mm in thickness and the mean joint space cartilage was 4 mm on the AP view of the femur [39]. If a physician were to account for the 2 mm thickness of the acetabular cartilage, as suggested when determining the femoral osteotomy level, this adjustment would be confounded by the natural femoral head asymmetry in the AP view of 1 mm. In comparison, a difference in 1 mm would equal ½ the mean reported acetabular cartilage and ¼ the reported joint space cartilage. Thus, this study shows that normal asymmetry of the femoral head would confound attempts at estimating osteotomy levels based on cartilage thickness if baseline symmetry is not known. The femoral head percent asymmetry had an upper limit of 1.8%, which was less than the 10% suggested to define coxa magna [14, 37]. Although the difference of 8% helps prevent false positives, it is unclear what asymmetry between 2% and 10% could represent and whether this is clinically important. It may be possible that this represents a subclinical Legg-Calvé-Perthes disease or even undiagnosed vascular disease. The femoral neck asymmetry data correspond to data from in literature (Table 9). The larger overall percent asymmetry of 3% of the femoral neck is an expected finding considering that it was a measure of a minimum dimension, a phenomenon corroborated by Pierre et al. [28].
Table 9.
Comparison of femoral neck diameters and differences reported in the literature
| Study | Femoral neck diameter (mm) | Femoral neck difference (mm) | |
|---|---|---|---|
| Ellis et al. [12] | CC, 14.4 | ND | |
| Hoaglund and Low [18] | AP | ||
| WM, 33 WF, 30 |
CM, 31 CF, 27 |
ND | |
| Noble et al. [27] | CC, 16.5 ± 2.9 | ND | |
| Sugano et al. [38] | AP, 30.8 ± 3.6 | ND | |
| Current study | AP, 36.5 ± 4.5 CC, 22.0 ± 3.0 |
AP, 1.1 ± 0.8 CC, 0.7 ± 0.6 |
|
Data are given as mean ± SD; CC = cephalocaudal; WM = white male; WF = white female; CM = Chinese male; CF = Chinese female; ND = measurements were not done in this particular study.
The dimensions of the femur are affected by gender and ethnicity [8, 16, 20, 26, 31, 40, 43, 44]. Other than a small correlation between increased height and increased AP femoral head symmetry, there was no association between asymmetry and age, weight, height, ethnicity, and gender. This supports the assumption of femoral symmetry despite body shape and form, which is supported by the literature [3, 46].
Asymmetries in the proximal femur are positively correlated to asymmetries in immediately adjacent segments of the proximal femur (femoral head to neck and femoral neck to shaft). This indicates that asymmetry does not happen in isolated segments. This is supported by research that indicates that femoral measurements are highly correlated with adjacent segments of the femur [27, 38], and that coxa magna shows ipsilateral head and neck enlargement [13, 24, 37]. Asymmetry in the AP plane was associated with asymmetry in the adjacent CC plane, suggesting that asymmetry does not occur only in one orthogonal plane. The magnitude of any femoral dimension is not correlated with magnitude of asymmetry.
In this age of evidence-based medicine, it has become increasingly important to justify medical conditions with corroborative data. All proximal femoral measurements conducted in this study showed bilateral differences less than 2 mm and percent asymmetries less than 4%. These results support the assumption of a high degree of symmetry in the left and right proximal femurs. The symmetry generally is independent of demographic data and the overall dimensions of the proximal femur. It also shows that when asymmetry does occur, it happens in proportion to adjacent segments of the proximal femur and in the orthogonal plane of the segment in question.
Acknowledgments
We thank Navkirat Bajwa BS, Yohannes Haile-Selassie PhD, Director of Physical Anthropology, and Lyman Jellema MS, Collections Manager, at the Cleveland Museum of Natural History for their help with this study.
Footnotes
Each author certifies that he or she has no commercial associations (eg, consultancies, stock ownership, equity interest, patent/licensing arrangements, etc) that might pose a conflict of interest in connection with the submitted article.
All ICMJE Conflict of Interest Forms for authors and Clinical Orthopaedics and Related Research editors and board members are on file with the publication and can be viewed on request.
Each author certifies that his or her institution has approved or waived approval for the human protocol for this investigation and that all investigations were conducted in conformity with ethical principles of research.
References
- 1.Arie E, Johnson F, Harrison MH, Hughes JR, Small P. Femoral head shape in Perthes’ disease: is the contralateral hip abnormal? Clin Orthop Relat Res. 1986;209:77–88. [PubMed] [Google Scholar]
- 2.Asala SA. Sex determination from the head of the femur of South African whites and blacks. Forensic Sci Int. 2001;117:15–22. doi: 10.1016/S0379-0738(00)00444-8. [DOI] [PubMed] [Google Scholar]
- 3.Auerbach BM, Ruff CB. Limb bone bilateral asymmetry: variability and commonality among modern humans. J Hum Evol. 2006;50:203–218. doi: 10.1016/j.jhevol.2005.09.004. [DOI] [PubMed] [Google Scholar]
- 4.Barrack RL, Burnett SJ. Preoperative planning for revision total hip arthroplasty. J Bone Joint Surg Am. 2005;87:2800–2811. doi: 10.2106/00004623-200512000-00028. [DOI] [PubMed] [Google Scholar]
- 5.Berry DJ, Harmsen WS, Cabanela ME, Morrey BF. Twenty-five-year survivorship of two thousand consecutive primary Charnley total hip replacements: factors affecting survivorship of acetabular and femoral components. J Bone Joint Surg Am. 2002;84:171–177. doi: 10.2106/00004623-200202000-00002. [DOI] [PubMed] [Google Scholar]
- 6.Casper DS, Kim GK, Parvizi J, Freeman TA. Morphology of the proximal femur differs widely with age and sex: relevance to design and selection of femoral prostheses. J Orthop Res. 2012;30:1162–1166. doi: 10.1002/jor.22052. [DOI] [PubMed] [Google Scholar]
- 7.Cleveland Museum of Natural History. Hamann-Todd Human Osteological Collection. Available at: http://www.cmnh.org/site/ResearchandCollections/PhysicalAnthropology/Collections/Hamann-ToddCollection.aspx. Accessed May 10, 2012.
- 8.Dargel J, Feiser J, Gotter M, Pennig D, Koebke J. Side differences in the anatomy of human knee joints. Knee Surg Sports Traumatol Arthrosc. 2009;17:1368–1376. doi: 10.1007/s00167-009-0870-5. [DOI] [PubMed] [Google Scholar]
- 9.Della Valle AG, Padgett DE, Salvati EA. Preoperative planning for primary total hip arthroplasty. J Am Acad Orthop Surg. 2005;13:455–462. doi: 10.5435/00124635-200511000-00005. [DOI] [PubMed] [Google Scholar]
- 10.Dore DD, Rubash HE. Primary total hip arthroplasty in the older patient: optimizing the results. Instr Course Lect. 1994;43:347–357. [PubMed] [Google Scholar]
- 11.Eggli S, Pisan M, Müller ME. The value of preoperative planning for total hip arthroplasty. J Bone Joint Surg Br. 1998;80:382–390. doi: 10.1302/0301-620X.80B3.7764. [DOI] [PubMed] [Google Scholar]
- 12.Ellis AR, Noble PC, Schroder SJ, Thompson MT, Stocks GW. The cam impinging femur has multiple morphologic abnormalities. J Arthroplasty. 2011;26(6 suppl):59–65. doi: 10.1016/j.arth.2011.04.028. [DOI] [PubMed] [Google Scholar]
- 13.Ferguson AB, Howorth MB. Coxa magna: a condition related to coxa plana. JAMA. 1935;104:808–812. doi: 10.1001/jama.1935.02760100018006. [DOI] [Google Scholar]
- 14.Fernandez De Valderama JA. The “observation hip” syndrome and its late sequelae. J Bone Joint Surg Br. 1963;45:462–470. [PubMed] [Google Scholar]
- 15.Fessy MH, Seutin B, Béjui J. Anatomical basis for the choice of the femoral implant in the total hip arthroplasty. Surg Radiol Anat. 1997;19:283–286. doi: 10.1007/BF01637590. [DOI] [PubMed] [Google Scholar]
- 16.Gonzalez Della Valle A, Comba F, Taveras N, Salvati EA. The utility and precision of analogue and digital preoperative planning for total hip arthroplasty. Int Orthop. 2008;32:289–294. doi: 10.1007/s00264-006-0317-2. [DOI] [PMC free article] [PubMed] [Google Scholar]
- 17.Gonzalez Della Valle A, Slullitel G, Piccaluga F, Salvati EA. The precision and usefulness of preoperative planning for cemented and hybrid primary total hip arthroplasty. J Arthroplasty. 2005;20:51–58. doi: 10.1016/j.arth.2004.04.016. [DOI] [PubMed] [Google Scholar]
- 18.Hoaglund FT, Low WD. Anatomy of the femoral neck and head, with comparative data from Caucasians and Hong Kong Chinese. Clin Orthop Relat Res. 1980;152:10–16. [PubMed] [Google Scholar]
- 19.Hofmann AA, Skrzynski MC. Leg-length inequality and nerve palsy in total hip arthroplasty: a lawyer awaits! Orthopedics. 2000;23:943–944. doi: 10.3928/0147-7447-20000901-20. [DOI] [PubMed] [Google Scholar]
- 20.Johnson AJ, Costa CR, Mont MA. Do we need gender-specific total joint arthroplasty? Clin Orthop Relat Res. 2011;469:1852–1858. doi: 10.1007/s11999-011-1769-2. [DOI] [PMC free article] [PubMed] [Google Scholar]
- 21.Kallio PE. Coxa magna following transient synovitis of the hip. Clin Orthop Relat Res. 1988;228:49–56. [PubMed] [Google Scholar]
- 22.Liu RW, Toogood P, Hart DE, Davy DT, Cooperman DR. The effect of varus and valgus osteotomies on femoral version. J Pediatr Orthop. 2009;29:666–675. doi: 10.1097/BPO.0b013e3181b769b5. [DOI] [PubMed] [Google Scholar]
- 23.Maloney WJ, Keeney JA. Leg length discrepancy after total hip arthroplasty. J Arthroplasty. 2004;19(4 suppl 1):108–110. doi: 10.1016/j.arth.2004.02.018. [DOI] [PubMed] [Google Scholar]
- 24.McAndrew MP, Weinstein SL. A long-term follow-up of Legg-Calvé-Perthes disease. J Bone Joint Surg Am. 1984;66:860–869. doi: 10.2106/00004623-198466060-00006. [DOI] [PubMed] [Google Scholar]
- 25.Meermans G, Malik A, Witt J, Haddad F. Preoperative radiographic assessment of limb-length discrepancy in total hip arthroplasty. Clin Orthop Relat Res. 2011;469:1677–1682. doi: 10.1007/s11999-010-1588-x. [DOI] [PMC free article] [PubMed] [Google Scholar]
- 26.Murshed KA, Cicekcibasi AE, Karabacakoglu A, Seker M, Ziylan T. Distal femur morphometry: a gender and bilateral comparative study using magnetic resonance imaging. Surg Radiol Anat. 2005;27:108–112. doi: 10.1007/s00276-004-0295-2. [DOI] [PubMed] [Google Scholar]
- 27.Noble PC, Alexander JW, Lindahl LJ, Yew DT, Granberry WM, Tullos HS. The anatomic basis of femoral component design. Clin Orthop Relat Res. 1988;235:148–165. [PubMed] [Google Scholar]
- 28.Pierre MA, Zurakowski D, Nazarian A, Hauser-Kara DA, Snyder BD. Assessment of the bilateral asymmetry of human femurs based on physical, densitometric, and structural rigidity characteristics. J Biomech. 2010;43:2228–2236. doi: 10.1016/j.jbiomech.2010.02.032. [DOI] [PMC free article] [PubMed] [Google Scholar]
- 29.Purkait R. Sex determination from femoral head measurements: a new approach. Leg Med (Tokyo). 2003;5(suppl 1):S347–S350. doi: 10.1016/S1344-6223(02)00169-4. [DOI] [PubMed] [Google Scholar]
- 30.Ranawat CS. The pants too short, the leg too long! Orthopedics. 1999;22:845–846. doi: 10.3928/0147-7447-19990901-16. [DOI] [PubMed] [Google Scholar]
- 31.Rawal B, Ribeiro R, Malhotra R, Bhatnagar N. Anthropometric measurements to design best-fit femoral stem for the Indian population. Indian J Orthop. 2012;46:46–53. doi: 10.4103/0019-5413.91634. [DOI] [PMC free article] [PubMed] [Google Scholar]
- 32.Rosenbaum TG, Hamblin T, Bloebaum RD. Determining the degree of cortical bone asymmetry in bilateral, nonpathological, human femur pairs. J Biomed Mater Res A. 2006;76:450–455. doi: 10.1002/jbm.a.30568. [DOI] [PubMed] [Google Scholar]
- 33.Rubin PJ, Leyvraz PF, Aubaniac JM, Argenson JN, Estève P, de Roguin B. The morphology of the proximal femur: a three-dimensional radiographic analysis. J Bone Joint Surg Br. 1992;74:28–32. doi: 10.1302/0301-620X.74B1.1732260. [DOI] [PubMed] [Google Scholar]
- 34.Scheerlinck T. Primary hip arthroplasty templating on standard radiographs: a stepwise approach. Acta Orthop Belg. 2010;76:432–442. [PubMed] [Google Scholar]
- 35.Sproul RC, Reynolds HM, Lotz JC, Ries MD. Relationship between femoral head size and distance to lesser trochanter. Clin Orthop Relat Res. 2007;461:122–124. doi: 10.1097/BLO.0b013e318054cfca. [DOI] [PubMed] [Google Scholar]
- 36.Strecker W, Keppler P, Gebhard F, Kinzl L. Length and torsion of the lower limb. J Bone Joint Surg Br. 1997;79:1019–1023. doi: 10.1302/0301-620X.79B6.7701. [DOI] [PubMed] [Google Scholar]
- 37.Stulberg SD, Cooperman DR, Wallensten R. The natural history of Legg-Calvé-Perthes disease. J Bone Joint Surg Am. 1981;63:1095–1108. [PubMed] [Google Scholar]
- 38.Sugano N, Noble PC, Kamaric E. Predicting the position of the femoral head center. J Arthroplasty. 1999;14:102–107. doi: 10.1016/S0883-5403(99)90210-3. [DOI] [PubMed] [Google Scholar]
- 39.Suh KT, Moon KP, Lee HS, Lee CK, Lee JS. Consideration of the femoral head cartilage thickness in preoperative planning in bipolar hemiarthroplasty. Arch Orthop Trauma Surg. 2009;129:1309–1315. doi: 10.1007/s00402-008-0758-8. [DOI] [PubMed] [Google Scholar]
- 40.Teitz CC, Lind BK, Sacks BM. Symmetry of the femoral notch width index. Am J Sports Med. 1997;25:687–690. doi: 10.1177/036354659702500517. [DOI] [PubMed] [Google Scholar]
- 41.Tonnis D, Heinecke A. Acetabular and femoral anteversion: relationship with osteoarthritis of the hip. J Bone Joint Surg Am. 1999;81:1747–1770. doi: 10.2106/00004623-199912000-00014. [DOI] [PubMed] [Google Scholar]
- 42.Toogood PA, Skalak A, Cooperman DR. Proximal femoral anatomy in the normal human population. Clin Orthop Relat Res. 2009;467:876–885. doi: 10.1007/s11999-008-0473-3. [DOI] [PMC free article] [PubMed] [Google Scholar]
- 43.Umer M, Sepah YJ, Khan A, Wazir A, Ahmed M, Jawad MU. Morphology of the proximal femur in a Pakistani population. J Orthop Surg (Hong Kong). 2010;18:279–281. doi: 10.1177/230949901001800304. [DOI] [PubMed] [Google Scholar]
- 44.Unnanuntana A, Toogood P, Hart D, Cooperman D, Grant RE. Evaluation of proximal femoral geometry using digital photographs. J Orthop Res. 2010;28:1399–1404. doi: 10.1002/jor.21119. [DOI] [PubMed] [Google Scholar]
- 45.Unnanuntana A, Toogood P, Hart D, Cooperman D, Grant RE. The evaluation of two references for restoring proximal femoral anatomy during total hip arthroplasty. Clin Anat. 2010;23:312–318. doi: 10.1002/ca.20921. [DOI] [PubMed] [Google Scholar]
- 46.Unnanuntana A, Wagner D, Goodman SB. The accuracy of preoperative templating in cementless total hip arthroplasty. J Arthroplasty. 2009;24:180–186. doi: 10.1016/j.arth.2007.10.032. [DOI] [PubMed] [Google Scholar]