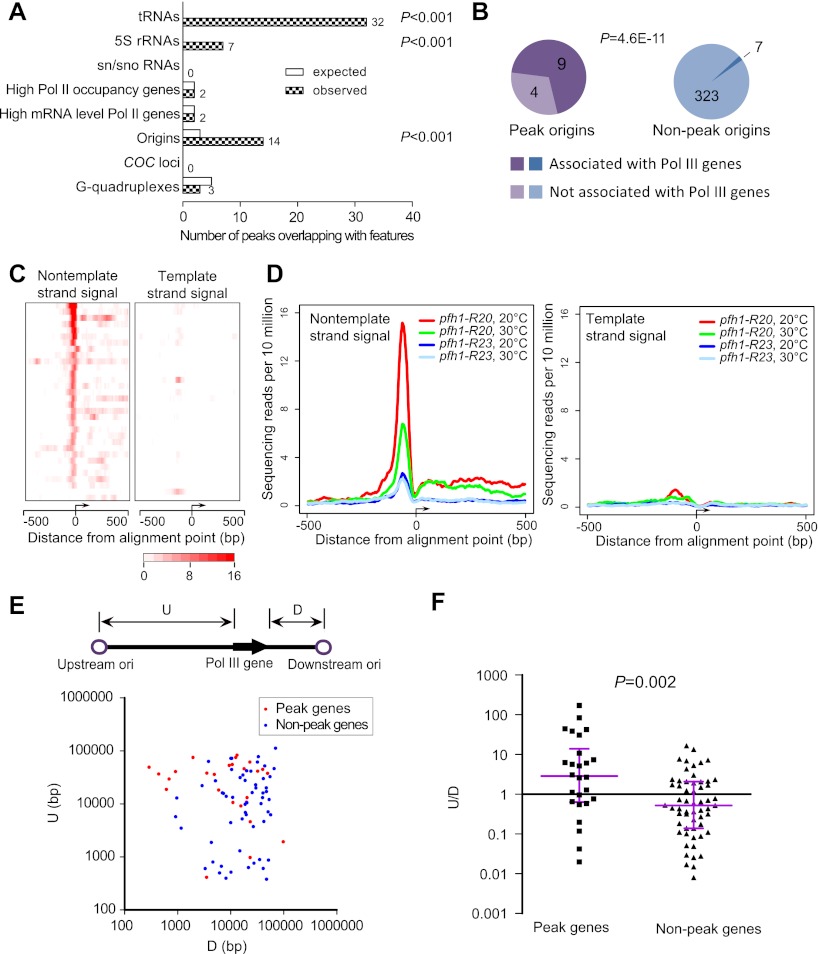
Figure 3.
Analysis of the narrow Rad52 peaks in pfh1-R20. (A) Rad52 peaks identified by MACS were analyzed to detect their associations with known genomic features. The numbers of observed peaks overlapping with genomic features are listed. For details, see Supplemental Methods. (B) Origins that overlap with Rad52 peaks are enriched with those close to Pol III genes. An origin is deemed associated with a Pol III gene if it is within 300 bp from a Pol III gene. P-value was determined by Fisher's exact test. (C) Heatmap representations of the SPI-seq signals at the 32 singleton peaks overlapping with Pol III genes. The peaks are aligned according to the Pol III gene transcription orientation, with the first nucleotide of the mature RNAs as the alignment point. (D) Average plots of Rad52 SPI-seq signals at the 32 singleton peaks overlapping with Pol III genes. The peaks are aligned as in C. (E) A scatter plot of the distances between Pol III genes and their neighboring origins. The distance from the 5′ end of a Pol III gene to its upstream origin was denoted as its “U” value, while the distance from the 3′ end to the downstream origin as its “D” value. Peak genes refer to the Pol III genes overlapping with the singleton peaks. To reduce errors caused by imprecise origin mapping, we did not include the genes whose distance to the closest origin is <250 bp. (F) The ratios of U/D for peak and nonpeak Pol III genes were plotted. P-value was obtained by comparing the log-transformed ratios of the two groups using Welch's t-test.

