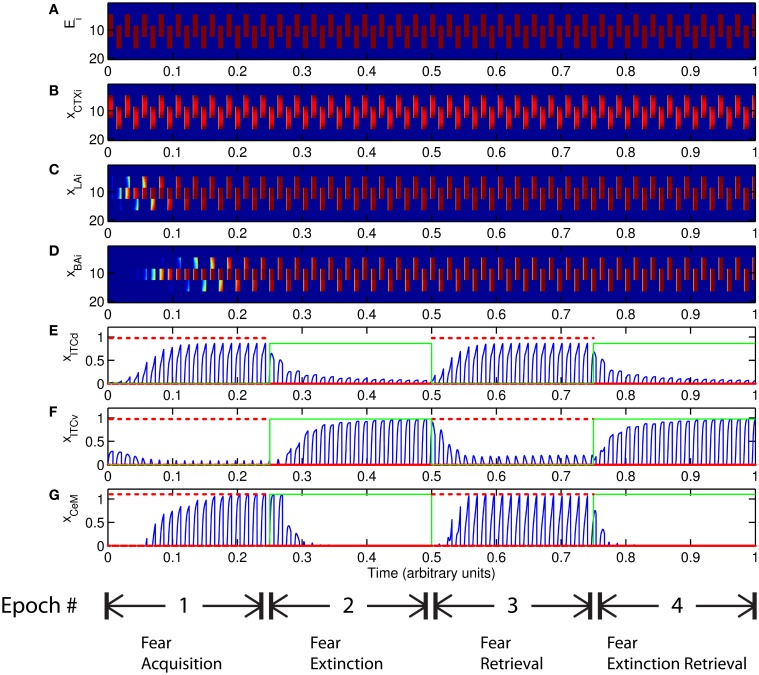
Figure 5.
Time course of model cell activities during “normal” mode. The system exhibits fear acquisition, extinction, fear retrieval, and extinction retrieval. Plots show the time evolution of model cell activities during four consecutive epochs. Each plot (A–D) shows the temporal evolution of an array of 20 cells, with the y-axis representing the cell index, and the color representing strength of activation (Blue is low, red is high). At any given time there is either a CS1-US pairing, a CS2-US pairing, a presentation of CS1 alone, a presentation of CS2 alone, or an intertrial interval. Because the features of CS1 and CS2 overlap, the indices of activation bars for corresponding representations in (A–D) also overlap. Each plot (E–G) shows the temporal evolution of a single cell, with the y-axis representing strength of activation of that cell. In the first and third epochs, the CS signals, shown in (A), co-occur with R+, the US. In the second and fourth epochs, the CS signals are presented without R+. The red dotted lines in (E–G) indicate presence of R+. The green lines indicate extinction epochs in which R+ = 0. (Parameters: strength of inhibition fI = 3.0; input from IL to ITCd EILd = 0; input from IL to ITCv EILv = 2).

