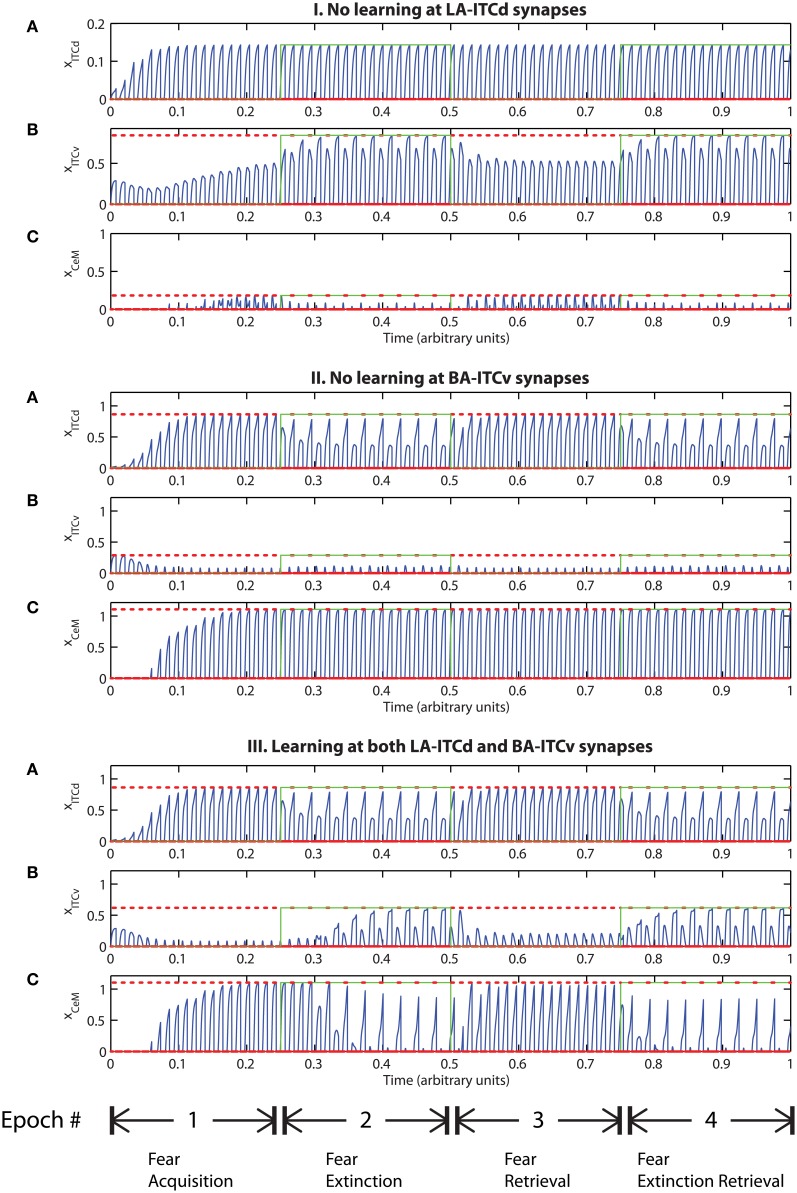
Figure 9.
Time evolution of model cell activities during “confusing” outcomes. Only one of the two overlapping CS signals is extinguished. (I) No learning occurs at the LA-ITCd synapses. (II) No learning occurs at the BA-ITCv synapses. (III) Learning occurs in both LA-ITCd and BA-ITCd weights. Each plot shows the temporal evolution of a single cell over four consecutive epochs, with the y-axis representing strength of activation. In the first and third epochs, the CS signals, shown in (A), co-occur with R+, the US. In the second and fourth epochs, one of the CS signals is presented without R+. The red dotted lines indicate presence of R+. The green lines indicate extinction epochs in which R+ = 0. (Parameters: strength of inhibition fI = 3.0; input from IL to ITCd EILd = 0; input from IL to ITCv EILv = 2).

