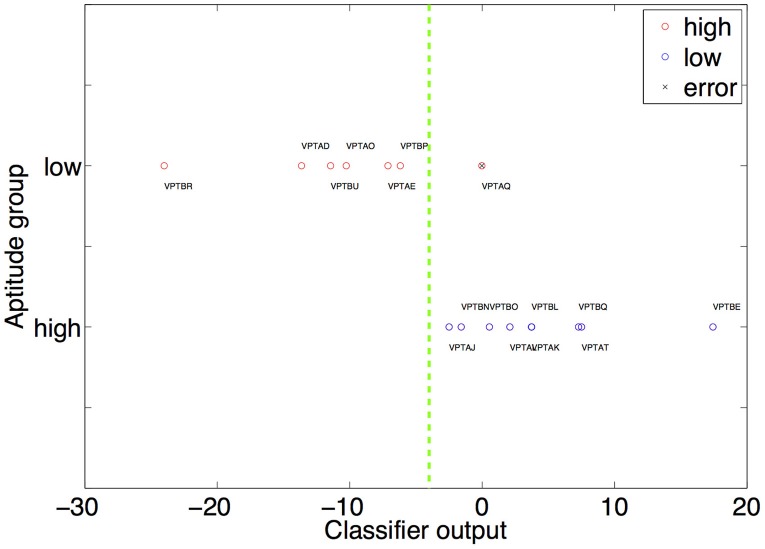
Figure 1.
The result of the multiplication of the weight and feature vector is shown on the x-axis. The high and low aptitude users are grouped on two separate horizontal lines on the y-axis (red circles high aptitude users, blue circles low aptitude users). This is only used to visually differentiate high from low aptitude users visually. The decision plane used by the classifier therefore has to be a horizontal line (dashed green line). It is optimally placed anywhere between VPTBP and VPTAJ. This placement causes the single error in our classification procedure (prediction of the group of VPTAQ, marked by a black “x”). The weights used to calculate the position of each participant are the ones obtained when this participant comprises the test dataset.

