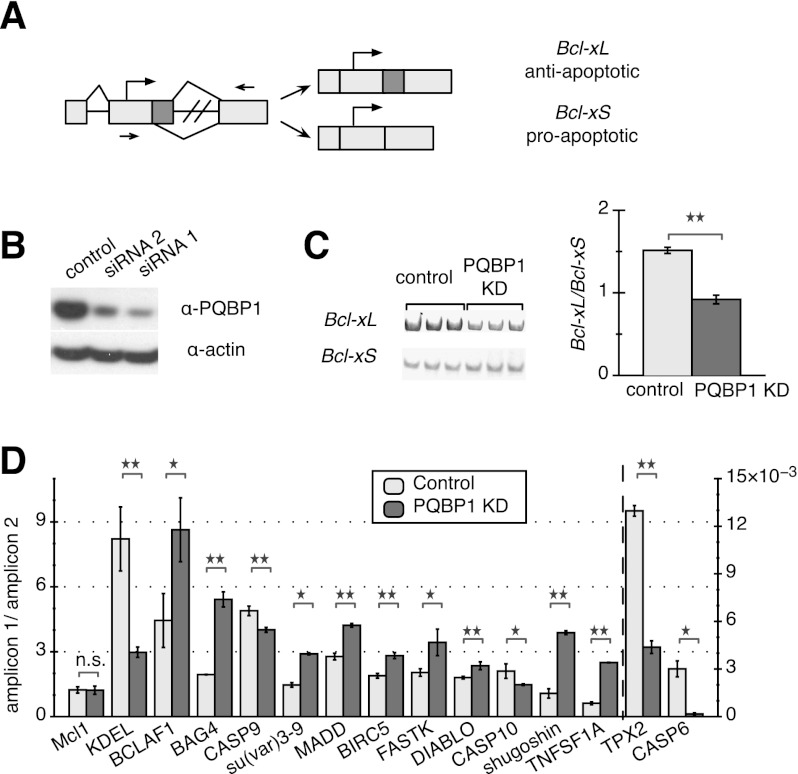
Figure 1.
AS targets of PQBP1 in HeLa cells. (A) Schematic of Bcl-x. Light rectangles are exons, with dark color marking the alternatively spliced region, and black lines are introns. Arrows show translation start sites, and arrowheads mark quantitative PCR primer sets. (B) Western blot of HeLa cell lysates where PQBP1 is knocked down by siRNA. The control sample was treated with a siRNA targeting firefly luciferase mRNA. Antibodies are listed on the right. Knockdown (KD) with two different siRNAs is shown. (C) Gel analysis of RT–PCR of Bcl-x splicing isoforms for control and PQBP1 knockdown samples is shown (left panel) with quantification (right panel). Mean of three independent measurements ± SD are shown. Changes were tested by one-way ANOVA. (**) Statistically significant with P-value < 0.01. See also Supplemental Figure S1, A and B. (D) Quantification of real-time PCR data on 14 mRNAs that showed significant AS changes between control and PQBP1 knockdown samples, with Mcl1 (not a target of PQBP1) as the negative control. The Y-axis depicts the ratio between amplicons for constitutive and alternative exonic regions; TPX-2 and CASP6 follow the Y-axis on the right side, while the rest follow the Y-axis on the left side. Light columns show the ratio of two amplicons from the control sample, and dark columns show the ratio of two amplicons from the PQBP1 knockdown sample. Mean of three independent measurements ± SD are shown. The difference of the ratio between control and PQBP1 knockdown samples was analyzed by one-way ANOVA test. (*) Statistically significant with P-value < 0.03; (**) statistically significant with P-value < 0.01; (n.s.) not significant. See also Supplemental Figure S1C.

