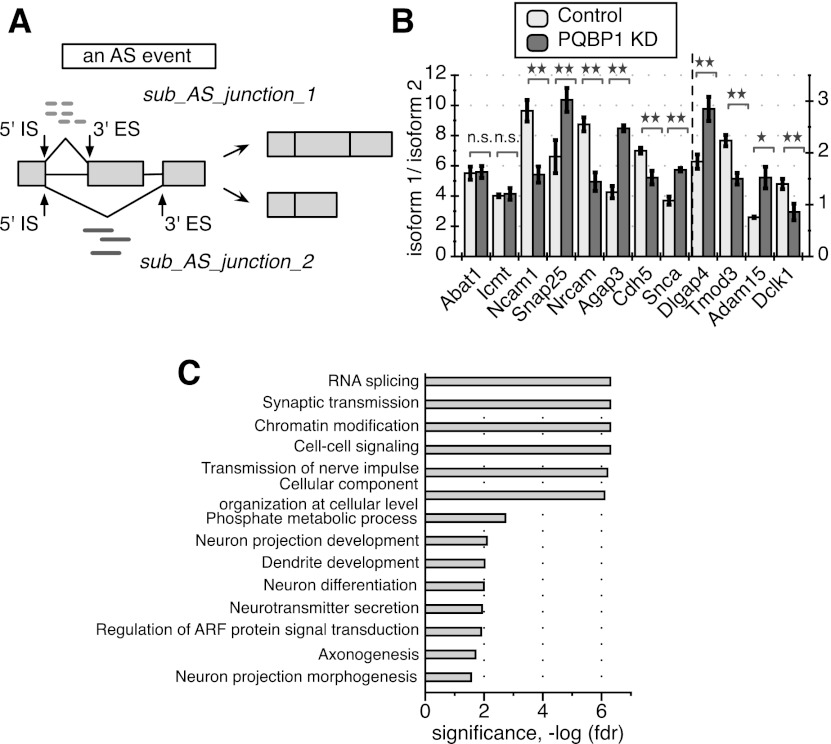
Figure 6.
PQBP1's AS targets in mouse embryonic cortical neurons. (A) A schematic of a defined AS event and quantification of splicing changes. A hypothetical alternatively spliced mRNA is shown, with light rectangles representing exons and black lines between exons representing introns. The middle exon is the alternatively spliced exon. The 5′ IS is the start of a splicing junction, and the 3′ ES is the end of the junction. The AS event shown here includes two sub-AS junctions that share the same 5′ IS. Light dashed short lines mark RNA-seq reads that are mapped to sub-AS junction 1, and dark solid short lines mark reads mapped to sub-AS junction 2. The distribution of reads mapped to the two sub-AS junctions was used for AS quantification in our analysis. See also Supplemental Figure S4, Supplemental Table S2, and the Supplemental Material. (B) RT–PCR validation of 10 randomly picked AS events identified as PQBP1 targets and two randomly picked AS events identified as non-PQBP1 targets in the computational analysis. Abat1 and Icmt were predicted non-PQBP1 targets. The Y-axis depicts the ratio between isoform 1 and isoform 2. Dlgap4, Tmod3, Adam15, and Dclk1 follow the Y-axis on the right side, while the rest follow the Y-axis on the left side. The mean of three independent measurements ± SD is shown. The differences between control and PQBP1 knockdown (KD) samples were analyzed by one-way ANOVA test. (*) Statistically significant with P-value < 0.05; (**) statistically significant with P-value < 0.01; (n.s.) not significant. (C) GO term functional enrichment of AS targets of PQBP1. Statistics were calculated with all genes that are expressed in mouse embryonic cortical neurons (profiled from RNA-seq data) as the background. The GO term enrichment profile here is specific compared with RNA-seq studies for other proteins in neurons (see the text). The X-axis is the corrected P-value (FDR) in negative log for enrichment. See also Supplemental Table S4.

