Figure 6.

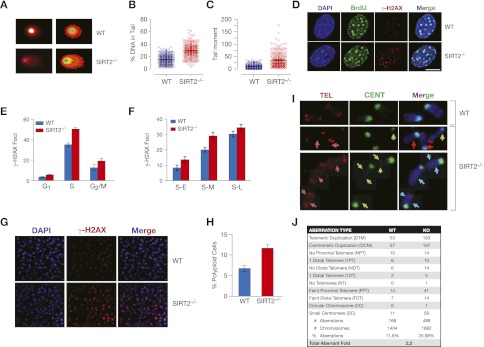
SIRT2−/− mice exhibit major DNA damage and genomic instability. (A) DNA damage in wild-type (WT) and SIRT2−/− primary fibroblasts, as measured by neutral comet assay. (B,C) Quantification of experiments shown in A. The data shown are the percentages of DNA present in the comet tail (B) or the tail moment quantification (C). (D) IF experiments on wild-type and SIRT2−/− MEFs of BrdU incorporation. DAPI staining of cells is shown as a control for DNA. (E) Quantitative analysis of γH2AX levels of wild-type and SIRT2−/− MEFs throughout progression of the cell cycle (n > 20 for each time point). (F) Quantitative analysis as in E, but focused on progression through S phase. (S-E) Early S phase; (S-M) middle S phase; (S-L) late S phase. (G) γH2AX levels in liver cryosections derived from wild-type or SIRT2−/− mice, detected by immunohistochemistry. (H) Quantification of polyploidy levels from the FACS profiles shown in Figure 5D in wild-type and SIRT2−/− fibroblasts. (I) IF of metaphase chromosome spreads from wild-type and SIRT2−/− primary fibroblasts stained with FISH chromosome paints for centromeres (CEN) and telomeres (TEL) and counterstained with DAPI. The arrows indicate chromosomal aberrations relative to lost or duplicated centromeres and telomeres. (J) Quantification of chromosomal aberrations observed in I.
