Figure 7.
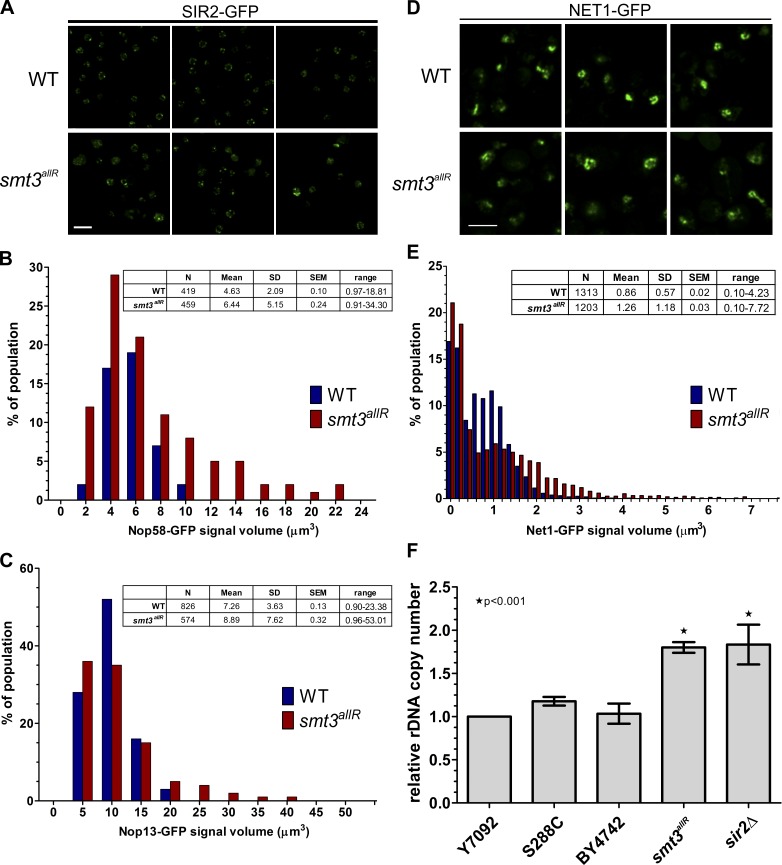
Nucleolar and telomere organization are disrupted in cells expressing the SUMO allR protein. (A) SIR2-GFP was imaged in log-phase cells in parental and smt3allR backgrounds. (B–E) GFP-tagged NOP58, NOP13, and NET1 strains were arrested in S phase by HU treatment and released into nocodazole-containing medium. Nucleolar/rDNA area was analyzed by quantifying NOP58 (n > 400), NOP13 (n > 500), and NET1 (n > 1,200) GFP signals. Volocity software was used to automate measurements of GFP signal volume across 9 z stacks. (D) Confocal micrographs of NET1-GFP in parental and smt3allR cells. Data shown are from a single representative experiment, conducted twice. Bars, 5 µm. (F) rDNA copy number (relative to the WT strain Y7092) was measured by qPCR using the ΔΔCt method. Experiments were performed in triplicate (where each reaction was also performed in triplicate); error bars indicate standard deviation.

