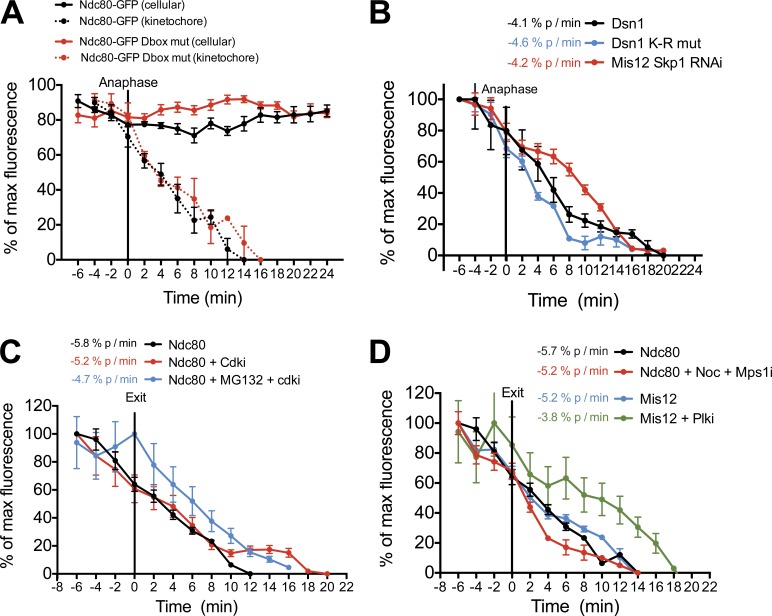
Figure 2.
Protein degradation and morphological changes at anaphase do not drive kinetochore disassembly. (A–D) Quantification of centromeric GFP intensities in cells exiting mitosis. At the onset of imaging, cells were treated with 5 µM flavopiridol (CDKi), 20 µM MG132, 200 ng/ml nocodazole (Noc), 10 µM BI2536 (Plki), or 2 µM AZ3146 (Mps1i) as indicated. n ≥ 8 cells, error bars represent SEM, and the rate of fluorescence change over time is indicated in percentage points per minute for each protein. mut, mutant.

