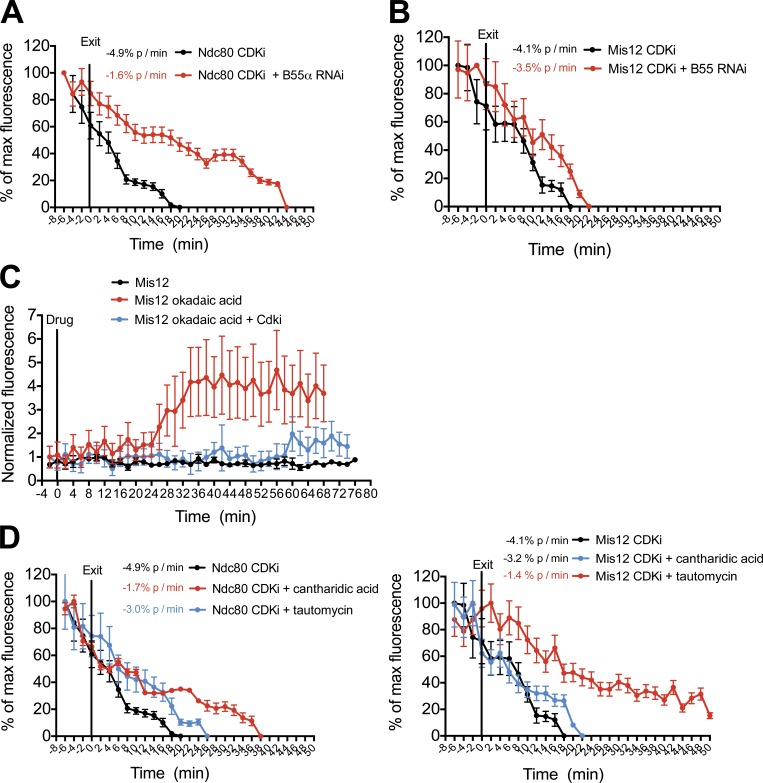
Figure 4.
CDK activity drives kinetochore assembly and disassembly. (A–E) Quantification of centromeric GFP intensity in cells exiting (A, B, D, and E) or entering (C) mitosis. Cells were imaged 48 h after depletion of PP2R2A–B55-α and immediately after treatment with 5 µM flavopiridol (CDKi; A and B), 30 min after treatment with 5 µM flavopiridol (CDKi) and immediately after treatment with 1 µM okadaic acid (C), and 30 min after treatment with 50 µM cantharidic acid or 3 µM tautomycin and immediately after treatment with 5 µM flavopiridol (CDKi; D and E). n ≥ 8 cells. Error bars represent SEM.

