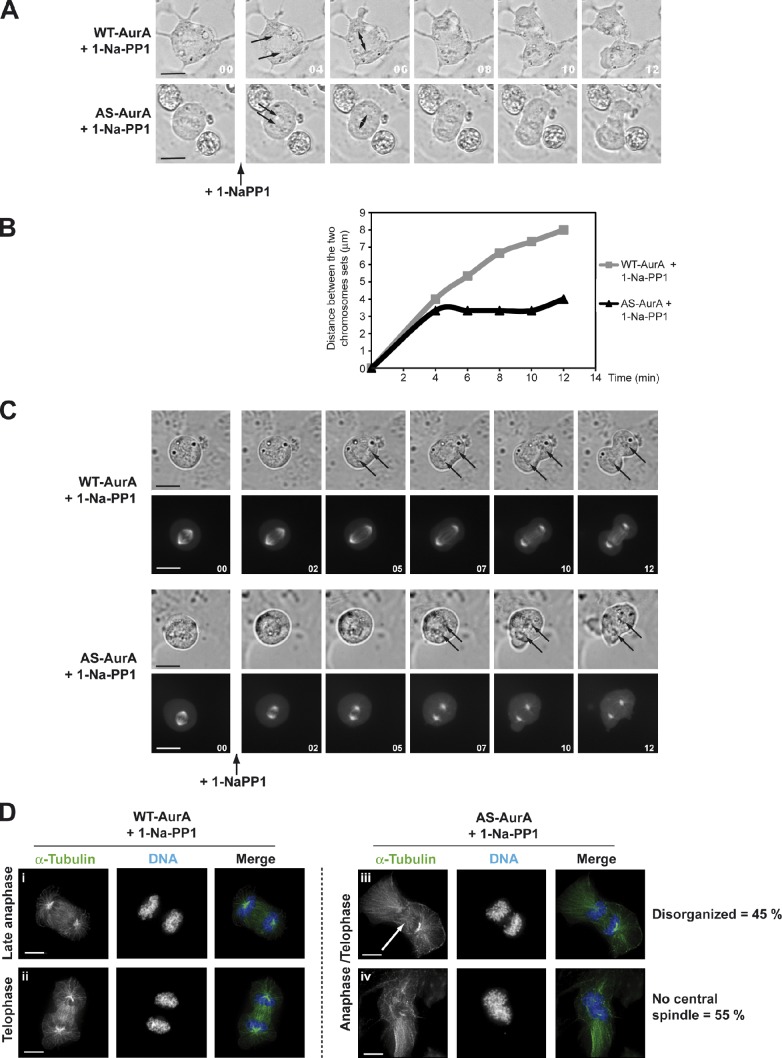
Figure 3.
Inhibition of Aurora A at anaphase onset causes central spindle assembly defects. (A) Time-lapse microscopy images showing late mitotic phases in WT-AurA and AS-AurA cells depleted of endogenous Aurora A and treated with 10 mM 1-Na-PP1. Time is given in minutes. The two arrows indicate separating chromosome sets. The double arrow indicates the distance measured and reported in B. (B) Graph showing the evolution of the distance (in micrometers) between the two sets of chromosomes of the WT-AurA and AS-AurA cells presented in A. Each curve is the recording of 1 experiment representative of 13 and 9 experiments, respectively. (C) Fluorescence and DIC time-lapse microscopy images showing late mitotic phases of WT-AurA and AS-AurA cells expressing GFP-tubulin, depleted of endogenous Aurora A and treated with 10 µM 1-Na-PP1. The two arrows indicate separating chromosome sets. Time is given in minutes. (D) IF microscopy of WT-AurA and AS-AurA cells depleted of endogenous Aurora A and treated with 10 µM 1-Na-PP1 at anaphase onset. The arrow shows the disorganized microtubules in the central spindle. Bars: (A and C) 10 µm; (D) 7 µm.

