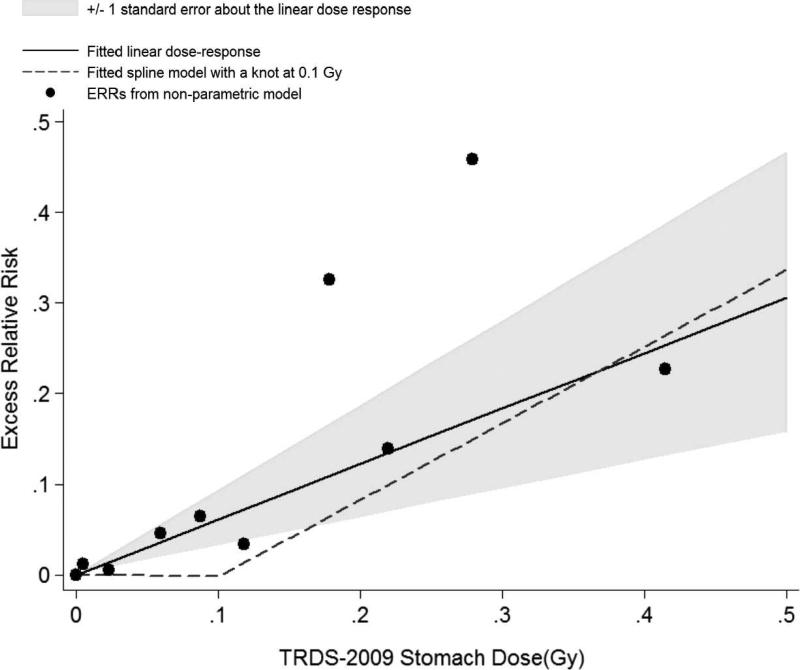
FIG. 1.
Solid cancer mortality dose response based on TRDS-2009 stomach doses. Circles represent ERR by dose categories from a nonparametric model. Fitted linear dose response (solid line) and fitted spline model with a knot at 0.1 Gy (dashed line) is also shown. The shaded area indicates the uncertainty (±1 standard error) about the linear dose response.

