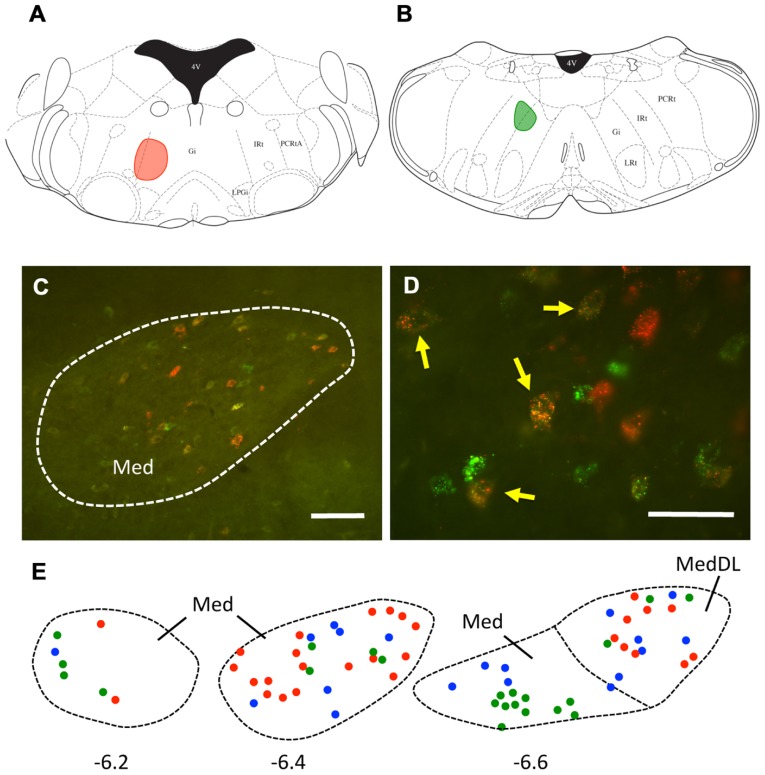
FIGURE 3.
A subset of mDCN neurons collateralize to rostral and caudal locations in the brainstem. (A,B) Plots of injection sites of rostral (red) and caudal (green) fluorescent microspheres in brainstem. (C) Retrogradely labeled mDCN neurons appear green or red, respectively; a subset (yellow) is double-labeled. Labeling is confined to the cell body. (D) High power picture of labeling, showing that double-labeled cells (arrows) could be reliably discriminated from single-labeled cells. Approximate level is -6.4 mm from bregma. (E) Plots of cells in the mDCN at rostral to caudal levels in a single animal (left to right); a subset of cells at each level are double-labeled (blue circles). Red and green circles correspond to cells labeled by rostral and caudal injections, respectively. Approximate rostral–caudal levels are -6.2, -6.4, and -6.6 mm from bregma (left to right). Scale bars: (C) = 100 mm; (D) = 50 mm. Atlas sections from Paxinos and Franklin (2001).

