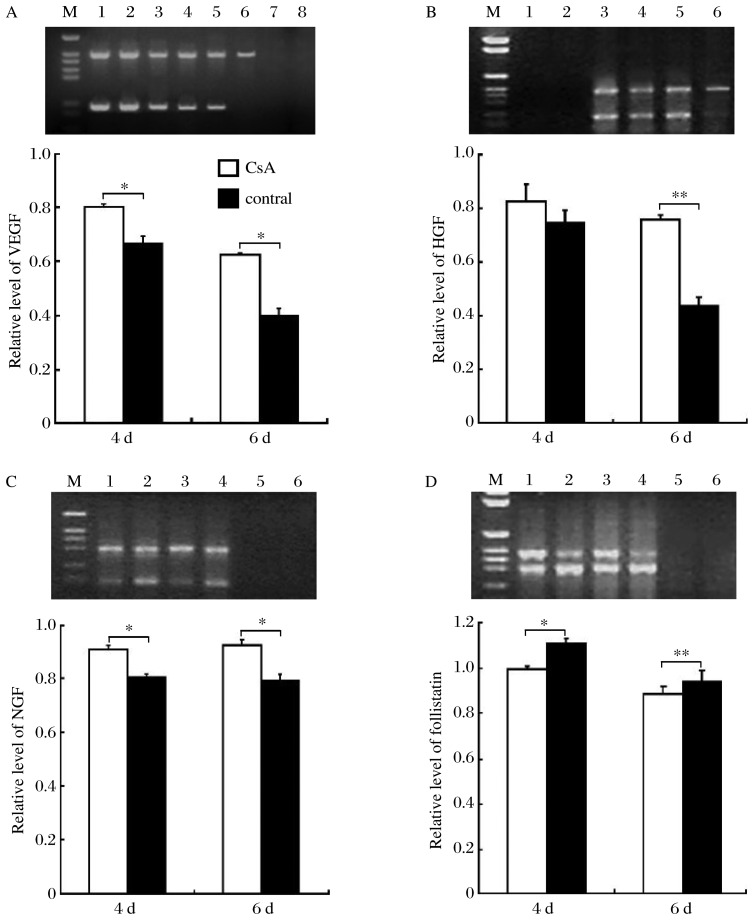
Fig. 4. RT-PCR analysis of VEGF, HGF, NGF and follistatin mRNA expressions in cultured mouse vibrissae follicles.
A Upper panel: RT-PCR for VEGF (207 bp) and β-actin (500 bp) in cyclosporine A (CsA)-treated group (Lane 1, 3, and 5), and the vehicle control group (Lane 2, 4, and 6) on d 2, 4 and 6, respectively. Lane 7 shows extracted mRNA, and Lane 8 shows the PCR product without cDNA templates. Lower panel: VEGF expression at d 4 and 6 post CsA treatment was normalized against beta-actin. B Upper panel: RT-PCR for HGF (263 bp) and β-actin (500 bp) in the CsA-treated group on d 2 (Lane 3) and 4 (Lane 4), and the vehicle control group on d 2 (Lane 5) and 4 (Lane 6). Lane 2 shows the extracted mRNA, and Lane 1 shows the PCR product without cDNA templates. Lower panel: HGF expression at d 4 and 6 post CsA treatment was normalized against beta-actin. C Upper panel: RT-PCR for NGF (216 bp) and β-actin (392 bp) in CsA-treated group (Lane 2 and 4), and the vehicle control group (Lane 1 and 3) on d 2 and 4, respectively. Lane 5 is extracted mRNA; lane 6 shows PCR product without cDNA templates. Lower panel: NGF expression at d 4 and 6 post CsA treatment was normalized against beta-actin. D Upper panel: RT-PCR for follistatin (500 bp) and β-actin (392 bp) in CsA-treated group (Lane 2 and 4), and the vehicle control group (Lane 1 and 3) on d 2 and 4, respectively. Lane 5 is extracted mRNA; lane 6 shows the PCR product without cDNA templates. Lower panel: follistatin expression at d 4 and 6 post CsA treatment was normalized against beta-actin. The mean density value for mRNA expression of VEGF, HGF, NGF and follistatin on d 4 and 6 of culture, using a Kodak digital camera and Kodak Digital Science 1DTM software. The expression levels are described as mean±SD; Compared with the control, *P < 0.05.

