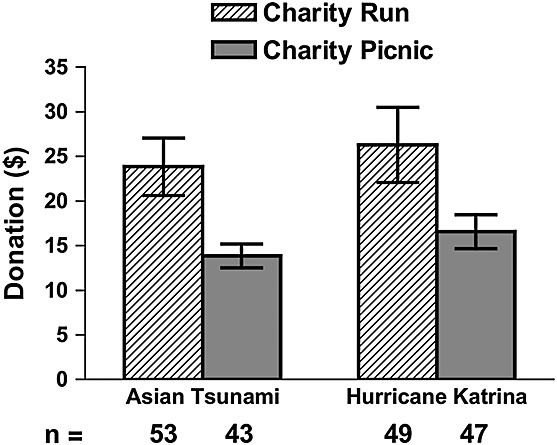
Figure 1.

Mean donations as a function of fundraising condition in Experiment 1A (bars on the left) and Experiment 1B (bars on the right). The means include nonparticipation responses, coded as $0 donations. Numbers underneath the bars indicate the sample size in each condition. Error bars represent ±1 standard error
