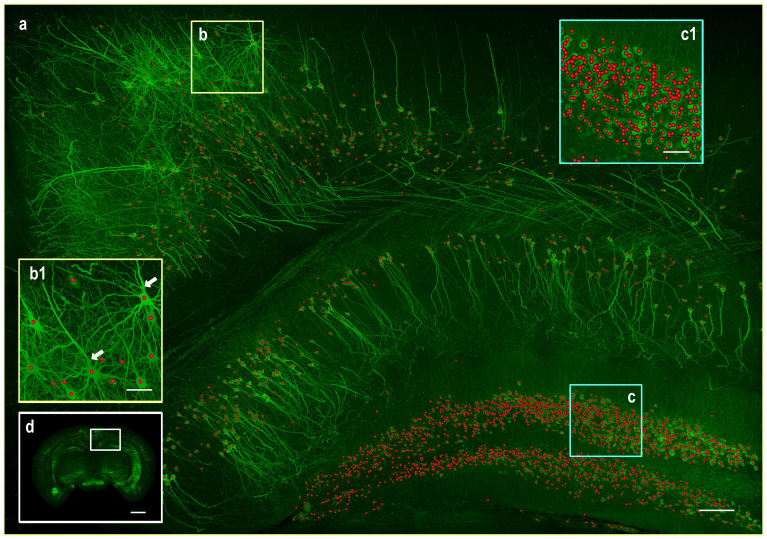
Figure 4. Automated localization of neurons across different mouse brain areas by using NeuroGPS.
(a) The max-intensity projection of image stacks and the recognized positions of neurons (red dots). The regions (b) and (c) were typical examples showing the complexity of the signals, and were enlarged to (b1) and (c1) respectively. The insect (d) shows the whole coronal profile. Arrows show thick trucks easily recognized as soma when not using the L1-M model. Scale bar, 100 μm for (a), 20 μm for (b1) and (c1), and 1000 μm for (d).

