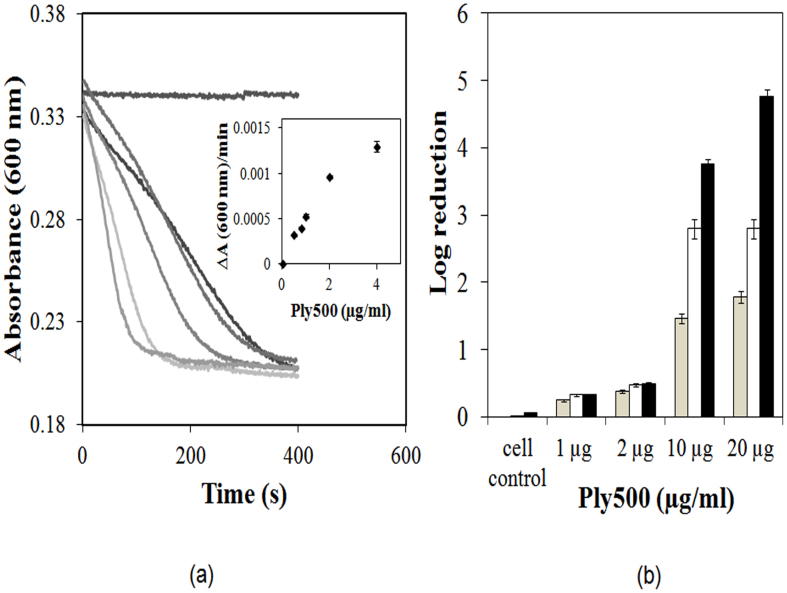
Figure 1.
(a) Activity of Ply500 against isolated L. innocua cell walls as measured by decrease in turbidity at 600 nm in Tris-HCl buffer (50 mM, pH 8.0) containing 250 mM NaCl. Curves (top to bottom) represent the no-enzyme cell wall control, 0.5, 0.8, 1, 2 and 4 μg/ml Ply500. All assays were performed in triplicate and the curves represent the mean value. Inset represents slopes as a function of Ply500 concentration. (b) Effect of Ply500 concentration on listeria killing using a viable plate counting assay after 3 h (grey), 6 h (white) and 24 h (black). L. innocua was grown in BHI media for 7 h. The assay cell challenge was 105 CFU/ml with a total reaction volume of 1-ml. Error bars represents standard deviations from triplicate measurements.

