Figure 1.
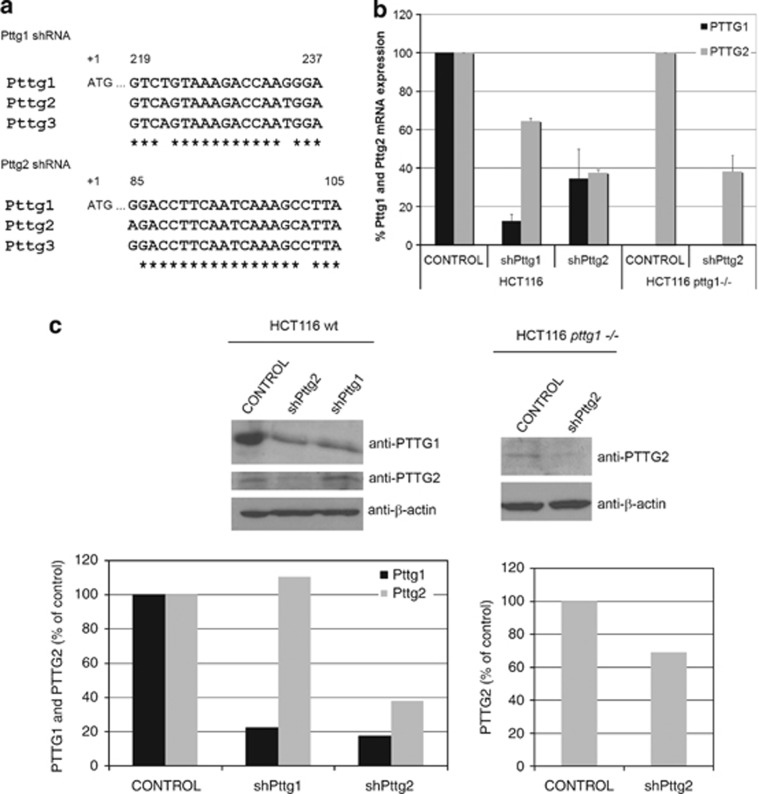
Characterization of Pttg2-depleted HCT116 cells. (a) Schematic diagram showing the sequences and location of shPttg1 and shPttg2. Multiple sequence alignments were made using the Clustal W software (www.clustal.org). (b) Relative quantification of Pttg1 and Pttg2 mRNA levels in Pttg1 and Pttg2-silenced HCT116 wild-type and HCT116 pttg1−/− cells by real-time PCR. Expression of each gene is shown as mean±S.E.M. of three independent experiments. Data are shown as 2−ΔCT normalized to HPRT1. (c) Analysis of PTTG1 and PTTG2 protein levels 72 h after shRNA-Pttg1 or shRNA-Pttg2 treatment in HCT116 wild-type and HCT116 pttg1−/− cells. β-Actin was used as loading control. Densitometric analysis for western blots of PTTG1 and PTTG2 protein expression (% of control) in control and shRNA-treated (shPttg1 or shPttg2) wild-type and Pttg1−/− HCT116 cells

